Chapter 1: Traditional and advanced costing methods
Chapter learning objectives
Upon completion of this chapter you will be able to:
- explain what is meant by the term cost driver and identify appropriate cost drivers under activity-based costing (ABC)
- calculate costs per driver and per unit using (ABC)
- compare ABC and traditional methods of overhead absorption based on production units, labour hours or machine hours
- explain what is meant by the term ‘target cost'
- derive a target cost in both manufacturing and service industries
- explain the difficulties of using target costing in service industries
- describe the target cost gap
- suggest how a target cost gap might be closed
- explain what is meant by the term ‘life-cycle costing' in a manufacturing industry
- identify the costs involved at different stages of the life-cycle
- explain throughput accounting and the throughput accounting ratio (TPAR), and calculate and interpret, a TPAR
- suggest how a TPAR could be improved
- apply throughput accounting to a given multi-product decision-making problem.
- discuss the issues a business faces in the management of environmental costs
- describe the different methods a business may use to account for its environmental costs

1 What is the purpose of costing?
Back to basics
In paper F2 we learnt how to determine the cost per unit for a product. We might need to know this cost in order to :
- Value inventory - the cost per unit can be used to value inventory in the statement of financial position (balance sheet).
- Record costs - the costs associated with the product need to be recorded in the income statement.
- Price products - the business will use the cost per unit to assist in pricing the product. For example, if the cost per unit is $0.30, the business may decide to price the product at $0.50 per unit in order to make the required profit of $0.20 per unit.
- Make decisions- the business will use the cost information to make important decisions regarding which products should be made and in what quantities.
How can we calculate the cost per unit?
So we know why it's so important for the business to determine thecost of its products. We now need to consider how we can calculate thiscost.
There are a number of costing methods available. This chapterfocuses on one of the modern costing techniques, ABC. However, in orderto understand ABC and the benefits that it can bring, it is useful tostart by reminding ourselves of the traditional absorption costingmethods : Absorption Costing (AC) and Marginal Costing (MC).
Absorption costing
The aim of traditional absorption costing is to determine the full production cost per unit.
When we use absorption costing to determine the cost per unit, wefocus on the production costs only. We can summarise these costs into acost card:

It is relatively easy to estimate the cost per unit for directmaterials and labour. In doing so we can complete the first two lines ofthe cost card.
However, it is much more difficult to estimate the production overheadper unit. This is an indirect cost and so, by its very nature, we do notknow how much is contained in each unit. Therefore, we need a method ofattributing the production overheads to each unit. All productionoverheads must be absorbed into units of production, using a suitablebasis, e.g. units produced, labour hours or machine hours. Theassumption underlying this method of absorption is that overheadexpenditure is connected to the volume produced.

 Illustration 1 - Absorption costing
Saturn, a chocolate manufacturer, produces three products:
- The Sky Bar, a bar of solid milk chocolate.
- The Moon Egg, a fondant filled milk chocolate egg.
- The Sun Bar, a biscuit and nougat based chocolate bar.
Information relating to each of the products is as follows:

Required:
Using traditional absorption costing, calculate the full productioncost per unit and the profit per unit for each product. Comment on theimplications of the figures calculated.


 Illustration - Solution
Solution
As mentioned, it is relatively easy to complete the first two linesof the cost card. The difficult part is calculating the productionoverhead per unit, so let's start by considering this. We need to absorbthe overheads into units of production. To do this, we will first needto calculate an overhead absorption rate (OAR):
The activity level must be appropriate for the business. Saturn must choose between three activity levels:
- Units of production - This would not be appropriate since Saturn produces more than one type of product. It would not be fair to absorb the same amount of overhead into each product.
- Machine hours or labour hours – It is fair to absorb production overheads into the products based on the labour or machine hours taken to produce each unit. We must decide if the most appropriate activity level is machine or labour hours. To do this we can look at the nature of the process. Production appears to be more machine intensive than labour intensive because each unit takes more machine hours to produce than it does labour hours. Therefore, the most appropriate activity level is machine hours.
Working - OAR
We can now absorb these into the units of production:

This is the difficult part done. We can now quickly complete the cost card and answer the question:
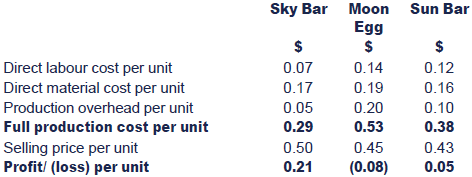
Outcome of absorption costing
Based on absorption costing, the Sky Bar and the Sun Bar are bothprofitable. However, the Moon Egg is loss making. Managers would need toconsider the future of the Moon Egg. They may look at the possibilityof increasing the selling price and/ or reducing costs. If this is notpossible, they may make the decision to stop selling the product.
However, this may prove to be the wrong decision because absorptioncosting does not always result in an accurate calculation of the fullproduction cost per unit. ABC can be a more accurate method ofcalculating the full production cost per unit and as a result shouldlead to better decisions.

2 Under- and over-absorption
A predetermined overhead absorption rate is used to smooth outseasonal fluctuations in overhead costs, and to enable unit costs to becalculated quickly throughout the year.

'Budgeted volume' may relate to units, direct labour hours, machinehours, etc. If either or both of the actual overhead cost or activityvolume differ from budget, the use of this rate is likely to lead towhat is known as under-absorption or over-absorption of overheads.

 Illustration 2 - Under- and over-absorption of overheads
A company budgeted to produce 3,000 units of a single product in a period at a budgeted cost per unit as follows:

In the period covered by the budget, actual production was 3,200units and actual fixed overhead expenditure was 5% above that budgeted.All other costs were as budgeted. What was the amount, if any, of over-or under-absorption of fixed overhead?


 Illustration - Solution
Answer
The Budgeted fixed overhead amounts to 3,000 units × $9 = $27,000.
Over/(under)absorption = Absorbed overheads – Incurred overheads.

The unit cost of production will include overhead at thepre-determined rate and, generally, overhead under- or over-absorbedwill be shown as a separate item in the costing income statement.

3 The modern manufacturing environment
There are two aspects of modern manufacturing that you need to befamiliar with – Total Quality Management (TQM) and Just in Time (JIT).
Total Quality Management
TQM is the continuous improvement in quality, productivity andeffectiveness through a management approach focusing on both the processand the product.
Fundamental features include:
- prevention of errors before they occur;
- importance of total quality in the design of systems and products;
- real participation of all employees;
- commitment of senior management to the cause;
- recognition of the vital role of customers and suppliers;
- recognition of the need for continual improvement.
Just-In-Time (JIT)
JIT is a pull-based system of production, pulling work through thesystem in response to customer demand. This means that goods are onlyproduced when they are needed, eliminating large stocks of materials andfinished goods.
Key characteristics for successfully operating such a system are:

Standard product costs are associated with traditional manufacturingsystems producing large quantities of standard items. Key features ofcompanies operating in a JIT and TQM environment are:
- high level of automation
- high levels of overheads and low levels of direct labour costs
- customised products produced in small batches
- low stocks
- emphasis on high quality and continuous improvement.
4 Reasons for the development of ABC
Absorption costing is based on the principal that productionoverheads are driven by the level of production. This is because theactivity level in the OAR calculation can be units, labour hours ormachine hours. These all increase as the level of production increases.This was true in the past, because businesses only produced one simpleproduct or a few simple and similar products. The following pointsshould be remembered:
- Overheads used to be small in relation to other costs in traditional manufacturing
In addition, production overheads, such as machine depreciation, will have been a small proportion of overall costs. This is because production was more labour intensive and, as a result, direct costs would have been much higher than indirect costs. A rough estimate of the production overhead per unit was therefore fine. - Overheads are now a larger proportion of total costs in modern manufacturing
Manufacturing has become more machine intensive and, as a result, the proportion of production overheads, compared to direct costs, has increased. Therefore, it is important that an accurate estimate is made of the production overhead per unit. - The nature of manufacturing has changed. Many companies must now operate in a highly competitive environment and, as a result, the diversity and complexity of products has increased.

 Illustration 3 – Pen factories
Consider two hypothetical plants turning out a simple product:Ball-point pens. The factories are the same size and have the samecapital equipment.
Every year, plant I makes 1 million units of only one product: blue pens.
Plant II, a full-line producer, also produces blue pens, but only100,000 a year. Plant II also produces a variety of similar products:80,000 black pens, 30,000 red pens, 5,000 green pens, 500 lavender pens,and so on. In a typical year, plant II produces up to 1,000 productvariations, with volumes ranging between 100 and 100,000 units. Itsaggregate annual output equals the 1 million pens of plant I.
The first plant has a simple production environment and requires limited manufacturing support facilities. With its higher diversity and complexityof operations, the second plant requires a much larger supportstructure. For example 1,000 different products must be scheduledthrough the plant, and this requires more people for :
- scheduling the machines;
- performing the set-ups;
- inspecting items;
- purchasing, receiving and handling materials;
- handling a large number of individual requests.
Expenditure on support overheads will therefore be much higher inthe second plant, even though the number of units produced and sold byboth plants is identical. Furthermore, since the number of unitsproduced is identical, both plants will have approximately the samenumber of direct labour hours, machine hours and material purchases. Themuch higher expenditure on support overheads in the second plant cannottherefore be explained in terms of direct labour, machine hoursoperated or the amount of materials purchased.
Traditional costing systems, however, use volume bases to allocatesupport overheads to products. In fact, if each pen requiresapproximately the same number of machine hours, direct labour hours ormaterial cost, the reported cost per pen will be identical in plant II.Thus blue and lavender pens will have identical product costs, eventhough the lavender pens are ordered, manufactured, packaged anddespatched in much lower volumes.
The small-volume products place a much higher relative demand onthe support departments than low share of volume might suggest.Intuitively, it must cost more to produce the low-volume lavender penthan the high-volume blue pen. Traditional volume-based costing systemstherefore tend to overcost high-volume products and undercost low-volumeproducts. To remedy this discrepancy ABC expands the second stageassignment bases for assigning overheads to products.

Calculating the full production cost per unit using ABC
There are five basic steps:
Step 1: Group production overheads into activities, according to how they are driven.
A cost pool is an activity which consumes resources and for which overhead costs are identified and allocated.
For each cost pool, there should be a cost driver. The terms ‘activity' and ‘cost pool' are often used interchangeably.
Step 2: Identify cost drivers for each activity, i.e. what causes these activity costs to be incurred.
A cost driver is a factor that influences (or drives) the level of cost.
Step 3: Calculate an OAR for each activity.
The OAR is calculated in the same way as the absorption costingOAR. However, a separate OAR will be calculated for each activity, bytaking the activity cost and dividing by the cost driver information.
Step 4: Absorb the activity costs into the product.
The activity costs should be absorbed back into the individual products.
Step 5: Calculate the full production cost and/ or the profit or loss.
Some questions ask for the production cost per unit and/ or the profit or loss per unit.
Other questions ask for the total production cost and/ or the total profit or loss.

 Illustration 4 - ABC
In addition to the data from illustration 1, some supplementary data is now available for Saturn company:

Cost driver data:

Required:
Using ABC, calculate the full production cost per unit and theprofit per unit for each product. Comment on the implications of thefigures calculated.


 Expandable Text
Step 1: Group production overheads into activities, according to how they are driven.
This has been done above. The $80,000 production overhead has been split into four different activities (cost pools).
Step 2: Identify cost drivers for each activity, i.e. what causes these activity costs to be incurred.

Step 3: Calculate an OAR for each activity


Step 5: Calculate the full production cost and the profit or loss

Outcome of ABC
When comparing the results of absorption costing and ABC, the SkyBar is slightly more profitable. The real surprise is the results forthe Moon Egg and the Sun Bar. The Moon Egg is now profitable and the SunBar is now loss making. This is because the production overheads havebeen absorbed in a more accurate way.
For example:
- There are twenty components in a Sun Bar, compared with only six in a Moon Egg. It is therefore fair that the Sun Bar receives more of the component cost.
- There are only four orders for the Moon Eggs but twenty five for the Sun Bar. It is therefore fair that the Sun Bar receives more of the packing costs.
ABC absorbs overheads more accurately and should therefore resultin better decision making. The managers at Saturn should be concernedabout the Sun Bar and not the Moon Egg, as was previously thought. Theywill now have to decide if it is possible to control the Sun Bar costsand/ or increase the selling price. If not, they may decide to stopselling the product.


 Test your understanding 1
Cabal makes and sells two products, Plus and Doubleplus. The directcosts of production are $12 for one unit of Plus and $24 per unit ofDoubleplus.
Information relating to annual production and sales is as follows:

Information relating to production overhead costs is as follows:
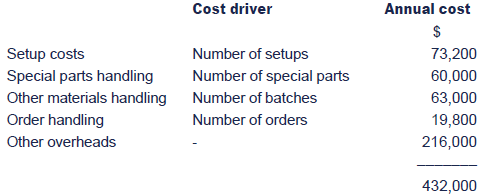
Other overhead costs do not have an identifiable cost driver, andin an ABC system, these overheads would be recovered on a direct labourhours basis.
(a) Calculate the production cost per unit ofPlus and of Doubleplus if the company uses traditional absorptioncosting and the overheads are recovered on a direct labour hours basis.
(b) Calculate the production cost per unit of Plus and of Doubleplus if the company uses ABC.
(c) Comment on the reasons for the differences in the production cost per unit between the two methods.
(d) What are the implications for management of using an ABC system instead of an absorption costing system?

Advantages and disadvantages of ABC
ABC has a number of advantages:
- It provides a more accurate cost per unit. As a result, pricing, sales strategy, performance management and decision making should be improved.
- It provides much better insight into what drives overhead costs.
- ABC recognises that overhead costs are not all related to production and sales volume.
- In many businesses, overhead costs are a significant proportion of total costs, and management needs to understand the drivers of overhead costs in order to manage the business properly. Overhead costs can be controlled by managing cost drivers.
- It can be applied to derive realistic costs in a complex business environment.
- ABC can be applied to all overhead costs, not just production overheads.
- ABC can be used just as easily in service costing as in product costing.
Disadvantages of ABC:
- ABC will be of limited benefit if the overhead costs are primarily volume related or if the overhead is a small proportion of the overall cost.
- It is impossible to allocate all overhead costs to specific activities.
- The choice of both activities and cost drivers might be inappropriate.
- ABC can be more complex to explain to the stakeholders of the costing exercise.
- The benefits obtained from ABC might not justify the costs.
5 Marginal costing
Marginal costing is the accounting system in which variable costsare charged to cost units and fixed costs of the period are written offin full against the aggregate contribution. Its special value is inrecognising cost behaviour, and hence assisting in decision making.
The marginal cost is the extra cost arising as a result ofmaking and selling one more unit of a product or service, or is thesaving in cost as a result of making and selling one less unit.
Contribution is the difference between sales value and the variable cost of sales. It may be expressed per unit or in total.

 Illustration 5 - Marginal costing
A company manufactures only one product called XY. The following information relates to the product :

Fixed costs for the period are $25,000.
Required:
Complete the following table :


 Solution

The table illustrates that contribution per unit remains constantat all levels of activity. However, profit per unit changes. Hencemarginal costing is a useful method when trying to analyse and managecosts. Absorption costing does not distinguish between fixed andvariable cost elements. It is not a useful method for internalreporting.

6 Throughput Accounting - Background
Throughput accounting aims to make the best use of a scare resource (bottleneck) in a JIT environment.
Throughput is a measure of profitability and is defined by the following equation:
Throughput = sales revenue - direct material cost
The aim of throughput accounting is to maximise this measure ofprofitability, whilst simultaneously reducing operating expenses andinventory (money is tied up in inventory).
The goal is achieved by determining what factors prevent the throughput from being higher. This constraint is called a bottleneck, for example there may be a limited number of machine hours or labour hours.
In the short-term the best use should be made of this bottleneck.This may result in some idle time in non-bottleneck resources, and mayresult in a small amount of inventory being held so as not to delayproduction through the bottleneck.
In the long-term, the bottleneck should be eliminated. For example anew, more efficient machine may be purchased. However, this willgenerally result in another bottleneck, which must then be addressed.
Main assumptions:
- The only totally variable cost in the short-term is the purchase cost of raw materials that are bought from external suppliers.
- Direct labour costs are not variable in the short-term. Many employees are salaried and even if paid at a rate per unit, are usually guaranteed a minimum weekly wage.

 Throughput calculation
Hard Tiles recorded a profit of $120,000 in the accounting periodjust ended, using marginal costing. The contribution/sales ratio was75%.
Material costs were 10% of sales value and there were no othervariable production overhead costs. Fixed costs in the period were$300,000.
Required:
What was the value of throughput in the period?
Solution


The Throughput Accounting Ratio
When there is a bottleneck resource, performance can be measured interms of throughput for each unit of bottleneck resource consumed.
There are three inter-related ratios:
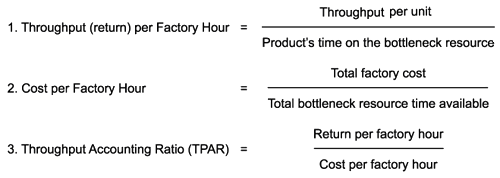
Note: The total factory cost is the fixed production cost, including labour. The total factory cost may be referred to as 'operating expenses'.
Interpretation of TPAR
- TPAR>1 would suggest that throughput exceeds operating costs so the product should make a profit. Priority should be given to the products generating the best ratios.
- TPAR<1 would="" suggest="" that="" throughput="" is="" insufficient="" to="" cover="" operating="" costs,="" resulting="" in="" a="">
Criticisms of TPAR
- It concentrates on the short-term, when a business has a fixed supply of resources (i.e. a bottleneck) and operating expenses are largely fixed. However, most businesses can't produce products based on the short term only.
- It is more difficult to apply throughput accounting concepts to the longer-term, when all costs are variable, and vary with the volume of production and sales or another cost driver. The business should consider this long-term view before rejecting products with a TPAR <>
- In the longer-term an ABC approach might be more appropriate for measuring and controlling performance.

 Test your understanding 2
X Limited manufactures a product that requires 1.5 hours ofmachining. Machine time is a bottleneck resource, due to the limitednumber of machines available. There are 10 machines available, and eachmachine can be used for up to 40 hours per week.
The product is sold for $85 per unit and the direct material cost per unit is $42.50. Total factory costs are $8,000 each week.
Calculate
(a)the return per factory hour
(b)the TPAR.


 Additional example on TPAR
A business manufactures a single product that it sells for $10 perunit. The materials cost for each unit of product sold is $3. Totaloperating expenses are $50,000 each month.
Labour hours are limited to 20,000 hours each month. Each unit of product takes 2 hours to assemble.
Required:
Calculate the throughput accounting ratio (TPAR)
Solution
- Throughput per factory (assembly) hour = $(10 – 3)/2 hours = $3.50
- Cost per factory hour = $50,000/20,000 hours = $2.50
Note: the operating expenses of $50,000 are the total factory cost.
- Throughput accounting ratio = $3.50/$2.50 = 1.40

Improving the TPAR
Options to increase the TPAR include the following:
- increase the sales price for each unit sold, to increase the throughput per unit
- reduce material costs per unit (e.g. by changing materials or switching suppliers), to increase the throughput per unit
- reduce total operating expenses, to reduce the cost per factory hour
- improve the productivity of the bottleneck, e.g. the assembly workforce or the bottleneck machine, thus reducing the time required to make each unit of product. Throughput per factory hour would increase and therefore the TPAR would increase.

 Improving the TPAR
Suppose in the illustration above the following changes were made:
- the sales price were increased from $10 to $13.5
- the time taken to make each product fell from 2 hours to 1.75 hours
- the operating expenses fell from $50,000 to $45,000.
The following changes would take place:
Throughput per factory hour = $(13.5 – 3)/1.75 hours = $6.0
Cost per factory hour = $45,000/20,000 hours = $2.25
TPAR = $6.0/ $2.25= 2.67
The TPAR would nearly double, increasing from 1.4 to 2.67.

Calculation 2 - Multi-product decision making
Throughput accounting may be applied to a multi-product decisionmaking problem in the same way as conventional key factor analysis.
The usual objective in questions is to maximise profit. Given thatfixed costs are unaffected by the production decision in the short run,the approach should be to maximise the throughput earned.
Step 1: identify the bottleneck constraint.
Step 2: calculate the throughput per unit for each product.
Step 3: calculate the throughput per unit of the bottleneck resource for each product.
Step 4: rank the products in order of the throughout per unit of the bottleneck resource.
Step 5: allocate resources using this ranking and answer the question.

 Test your understanding 3
Justin Thyme manufactures four products, A, B, C and D. Details ofsales prices, costs and resource requirements for each of the productsare as follows.
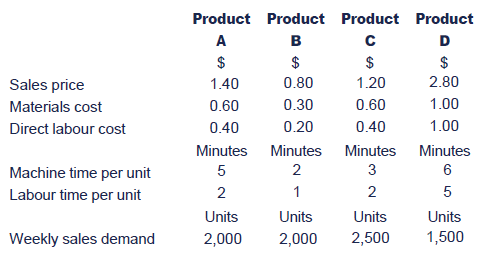
Machine time is a bottleneck resource and the maximum capacity is400 machine hours each week. Operating costs, including direct labourcosts, are $5,440 each week. Direct labour costs are $12 per hour, anddirect labour workers are paid for a 38-hour week, with no overtime.
(a)Determine the quantities of each productthat should be manufactured and sold each week to maximise profit andcalculate the weekly profit.
(b)Calculate the throughput accounting ratio at this profit-maximising level of output and sales.

7 Target costing
Target costing involves setting a target cost by subtracting adesired profit from a competitive market price. Real world users includeSony, Toyota and the Swiss watchmakers, Swatch.
In effect it is the opposite of conventional 'cost plus pricing'.

 Illustration 6
Music Matters manufactures and sells cds for a number of popularartists. At present, it uses a traditional cost-plus pricing system.
Cost-plus pricing system
(1) The cost of the cd is established first. This is $15 per unit.
(2) A profit of $5 per unit is added to each cd.
(3) This results in the current selling price of $20 per unit.
However, cost-plus pricing ignores:
- The price that customers are willing to pay - pricing the cds too high could result in low sales volumes and profits.
- The price charged by competitors for similar products - if competitor's are charging less than $20 per cd for similar cds then customers may decide to buy their cds from the competitor companies.
- Cost control - the cost of the cd is established at $15 but there is little incentive to control this cost.
Target costing
Music Matters could address the problems discussed above through the implementation of target costing:
(1) The first step is to establish acompetitive market price. The company would consider how much customersare willing to pay and how much competitors are charging for similarproducts. Let's assume this is $15 per unit.
(2) Music Matters would then deduct their required profit from the selling price. The required profit may be kept at $5 per unit.
(3) A target cost is arrived at by deducting the required profit from the selling price, i.e. $15 – $5 = $10 per unit.
(4) Steps must then be taken to close thetarget cost gap from the current cost per unit of $15 per unit to thetarget cost of $10 per unit.

Summary of the steps used in deriving a target cost
Steps
(1) Estimate a selling price for a new productthat considers how much competitors are charging and how much customersare willing to pay. This selling price will enable a firm to capture arequired share of the market.
(2) Reduce this figure by the firm's requiredlevel of profit. This could take into account the return required on anynew investment and on working capital requirements or could involve atarget margin on sales.
(3) Produce a target cost figure for product designers to meet.
(4) Reduce costs to provide a product that meets that target cost.

 Test your understanding 4
LMN Ltd makes and sells two products, X and Y. Both products aremanufactured through two consecutive processes - assembly and finishing.Raw material is input at the commencement of the assembly process.
The following estimated information is available for the period ending 31 December 20X5:

LMN Ltd uses a minimum contribution/sales (C/S) ratio target of 25%when assessing the viability of a product. In addition, management wishto achieve an overall net profit margin of 12% on sales in this periodin order to meet return on capital targets.
Required:
Calculate the C/S ratio for each product and the overall net profitmargin. Explain how target costing may be used in achieving therequired returns.

Closing the target cost gap
The target cost gap is established in step 4 of the target costing process.
Target cost gap = Estimated product cost – Target cost
It is the difference between what an organisation thinks it cancurrently make a product for, and what it needs to make it for, in orderto make a required profit.
Alternative product designs should be examined for potential areasof cost reduction that will not compromise the quality of the products.
Questions that a manufacturer may ask in order to close the gap include:
- Can any materials be eliminated, e.g. cut down on packing materials?
- Can a cheaper material be substituted without affecting quality?
- Can labour savings be made without compromising quality, for example, by using lower skilled workers?
- Can productivity be improved, for example, by improving motivation?
- Can production volume be increased to achieve economies of scale?
- Could cost savings be made by reviewing the supply chain?
- Can part-assembled components be bought in to save on assembly time?
- Can the incidence of the cost drivers be reduced?
- Is there some degree of overlap between the product-related fixed costs that could be eliminated by combining service departments or resources?
A key aspect of this is to understand which features of the productare essential to customer perceived quality and which are not. Thisprocess is known as ‘value analysis'. Attention should be focused moreon reducing the costs of features perceived by the customer not to addvalue.

 Test your understanding 5
The Swiss watchmaker Swatch reportedly used target costing in orderto produce relatively low-cost, similar-looking plastic watches in acountry with one of the world's highest hourly labour wage rates.
Suggest ways in which Swatch may have reduced their unit costs for each watch.


 Target costing in service organisations
Target costing is as relevant to the service sector as themanufacturing sector. Key issues are similar in both: the needs of themarket need to be identified and understood as well as its customers andusers; and financial performance at a given cost or price (which doesnot exceed the target cost when resources are limited) needs to beensured.
For example, if a firm of accountants was asked to bid for a newclient contract, the partners or managers would probably have an idea ofwhat kind of price is likely to win the contract. If staff costs arebilled out at twice their hourly salary cost, say, this would help todetermine a staff budget for the contract. It would then be necessary towork out the hours needed and play around with the mix of juniors /senior staff to get to that target cost.
There are ways in which target costing can be applied toservice-oriented businesses, and the focus of target costing shifts fromthe product to the service delivery system.
ILLUSTRATION : TARGET COSTING IN THE NHS
In 2005, theNational Audit Office and the Audit Commission identified the need forimprovements in financial skills to meet the challenges facing thehealth service, as first-class financial management has a vital role indelivering improvements to patients. A number of healthcare providers inthe United States had recently made significant improvements to patientcare and resource utilisation by adopting approaches used inmanufacturing businesses, including target costing principles, which isthought to have contributed towards significant benefits in improvedquality of care, decreased mortality and cost reduction.
Target costing was thought of as a better method of costingservices, in order to help NHS Trusts and hospitals to meet theirfinancial responsibility to at least break-even, by ensuring thatservices are delivered within budgeted costs. Therefore, a move towards anew method of funding services was initiated, with NHS Trusts beingpaid a pre-set national tariff for each service they provide, rather than a price based on their own costs.
Take the example of Mrs Smith, who suffers from a medical conditionrequiring hospital care. She is booked into Guy's + St Thomas'shospital NHS Foundation Trust for a procedure this month. Lambeth PCT isthe responsible commissioner for Mrs Smith's care, because she isregistered with a GP practice there. The national tariff for theprocedure amounts to £3,236, adjusted by two daily long stay paymentsat £740 a day. Therefore, the reimbursement from Lambeth PCT to StGuy's hospital for the procedure would amount to a total of £3,976.
It was hoped that target costing, with targets related to thenational tariff and coupled with an emphasis on value-for-moneyperformance indicators , might provide a discipline within which Trustscould manage costs to improve efficiency. In a case like Mrs Smith's, atarget cost would hopefully encourage the hospital to perform theoperation within this costs and promote better scheduling, use ofcheaper drugs, etc.
PROBLEMS WITH TARGET COSTING IN SERVICE INDUSTRIES
Unlike manufacturing, service industries have the following characteristics which could make target costing more difficult :
1. Bureaucracy - Davila and Wouters (2004) criticised targetcosting for being too detailed, bureaucratic and time-consuming. Targetcosting does require formal procedures to assess customer needs,determine target prices and costs, break perceived value down tosub-services to come up with allowable cost per service, and apply valueengineering to achieve the target cost in an iterative manner.
2. The intangibility of what is provided means that it isdifficult to define the ‘service' and attribute costs; in the NHS, itis challenging to define what a ‘procedure' is. Clinical specialitiescover a wide range of disparate treatments, and services include highlevels of indirect cost. Consistent methods of cost attribution areneeded, and this is not always straightforward. Direct charging is notalways possible and there are different configurations of cost centresacross providers. This may limit the consistency which can be achieved.
3. Heterogeneity – The quality and consistency varies,because of an absence of standards or benchmarks to assess servicesagainst. In the NHS, there is no indication of what an excellentperformance in service delivery would be, or any definition ofunacceptable performance.
4. The continual pressure to ensure costs are kept to a minimum can lead to employee de-motivation.


 Value analysis
Value analysis, otherwise known as ‘cost engineering' and‘value engineering', is a technique in which a firm's products, andmaybe those of its competitors, are subjected to a critical andsystematic examination by a small group of specialists. They can berepresenting various functions such as design, production, sales andfinance.
Value analysis asks of a product the following questions:
- Does the use of the product contribute value?
- Is its cost proportionate to its usefulness?
- Does it need all of its features?
- Is there anything better for the intended use?
- Can a usable part be made better at lower cost?
- Can a standard product be found which will be equally usable?
- Is it made on appropriate tooling, considering the quantities used?
- Do material, labour, and overheads constitute total cost?
- Will another dependable supplier provide it for less cost?
- Is anyone buying it for less than its stated price?
The strategic implications can be measured in terms of acomponent's relative cost versus its relative performance. There arefour different situations:
(1) If a component is both more expensive andinferior to that of a competitor, a strategic problem requiring changemight be necessary. It could be, however, that the component is such asmall item in terms of both cost and impact on the customer that itshould be ignored.
(2) If the component is competitively superior,a value analysis, where a component's value to the customer isquantified, may suggest a price increase or promotion campaign.
(3) If a component is less expensive than butinferior to that of a competitor, a value analysis might suggest eitherde-emphasising that part or upgrading the relative rating.
(4) If a component is less expensive than andsuperior to that of a competitor, a value analysis might suggest thatcomponent is emphasised, perhaps playing a key role in promotion andpositioning strategies.
A cost advantage may be obtained in many ways, e.g. economies ofscale, the experience curve, product design innovations and the use of‘no-frills' product offering. Each provides a different way ofcompeting on the basis of cost advantage.

8 Life-cycle costing
Traditional costing techniques based around annual periods may givea misleading impression of the costs and profitability of a product.This is because systems are based on the financial accounting year, anddissect the product's lifecycle into a series of annual sections.Usually, therefore, the management accounting systems would assess aproduct's profitability on a periodic basis, rather than over its entirelife.
Lifecycle costing, however, tracks and accumulates costs and revenues attributable to each product over its entire product lifecycle. Hence, the total profitability of any given product can be determined.
A product's costs are not evenly spread through its life.
According to Berliner and Brimson (1988), companies operating in an advanced manufacturing environment are finding that about 90% of a product's lifecycle costs are determined by decisions made early in the cycle.In many industries, a large fraction of the life-cycle costs consistsof costs incurred on product design, prototyping, programming, processdesign and equipment acquisition.
This had created a need to ensure that the tightest controls are atthe design stage, i.e. before a launch, because most costs arecommitted, or 'locked-in', at this point in time.
Management Accounting systems should therefore be developed thataid the planning and control of product lifecycle costs and monitorspending and commitments at the early stages of a product's life cycle.

 The product life-cycle
The costs involved at different stages in the product life-cycle
Most products have a distinct product life-cycle:
Specific costs may be associated with each stage.
(1) Pre-production/Product development stage
- A high level of setup costs will be incurred in this stage (preproduction costs), including research and development (R&D), product design and building of production facilities.
(2) Launch/Market development stage
- Success depends upon awareness and trial of the product by consumers, so this stage is likely to be accompanied by extensive marketing and promotion costs.
(3) Growth stage
- Marketing and promotion will continue through this stage.
- In this stage sales volume increases dramatically, and unit costs fall as fixed costs are recovered over greater volumes.
(4) Maturity stage
- Initially profits will continue to increase, as initial setup and fixed costs are recovered.
- Marketing and distribution economies are achieved.
- However, price competition and product differentiation will start to erode profitability as firms compete for the limited new customers remaining
(5) Decline stage
- Marketing costs are usually cut as the product is phased out
- Production economies may be lost as volumes fall
- Meanwhile, a replacement product will need to have been developed, incurring new levels of R&D and other product setup costs.
- Alternatively additional development costs may be incurred to refine the model to extend the life-cycle (this is typical with cars where ‘product evolution' is the norm rather than ‘product revolution').

There are a number of factors that need to be managed in order to maximise a product's return over its lifecycle:
Design costs out of the product:
It was stated earlier that around 90% of a product's costs were oftenincurred at the design and development stages of its life. Decisionsmade then commit the organisation to incurring the costs at a laterdate, because the design of the product determines the number ofcomponents, the production method, etc. It is absolutely vital thereforethat design teams do not work in isolation but as part of across-functional team in order to minimise costs over the whole lifecycle.
Value engineering helps here; for example, Russian liquid-fuelrocket motors are intentionally designed to allow leak-free welding.This reduces costs by eliminating grinding and finishing operations(these operations would not help the motor to function better anyway.)
Minimise the time to market:
In a world where competitors watch each other keenly to see what newproducts will be launched, it is vital to get any new product into themarketplace as quickly as possible. The competitors will monitor eachother closely so that they can launch rival products as soon as possiblein order to maintain profitability. It is vital, therefore, for thefirst organisation to launch its product as quickly as possible afterthe concept has been developed, so that it has as long as possible toestablish the product in the market and to make a profit beforecompetition increases. Often it is not so much costs that reduce profitsas time wasted.
Maximise the length of the life cycle itself:
Generally, the longer the life cycle, the greater the profit that willbe generated, assuming that production ceases once the product goesinto decline and becomes unprofitable. One way to maximise the lifecycle is to get the product to market as quickly as possible becausethis should maximise the time in which the product generates a profit.
Another way of extending a product's life is to find other uses, ormarkets, for the product. Other product uses may not be obvious whenthe product is still in its planning stage and need to be planned andmanaged later on. On the other hand, it may be possible to plan for astaggered entry into different markets at the planning stage.
Many organisations stagger the launch of their products indifferent world markets in order to reduce costs, increase revenue andprolong the overall life of the product. A current example is the way inwhich new films are released in the USA months before the UK launch.This is done to build up the enthusiasm for the film and to increaserevenues overall. Other companies may not have the funds to launchworldwide at the same moment and may be forced to stagger it. Skimmingthe market is another way to prolong life and to maximise the revenueover the product's life.

 Illustration 7 – Lifecycle costing
Enrono is an accounting software package which has a six-yearproduct lifecycle. The following are the yearly costs, estimated for theentire length of the package's life :
The lifecycle costs for the Enrono package can be added up as follows :

Lifecycle costing clearly takes into consideration the costs of thepackage incurred during the entire lifecycle - over $1.5 m.Accordingly, from lifecycle costing, the management can know whether therevenue earned by the product is sufficient to cover the whole costsincurred during its life cycle.
When viewed as a whole, there are opportunities for cost reductionand minimisation (and thereby scope for profit maximisation) in severalcategories of cost :
- For example, initiatives could be taken to reduce testing costs and therefore the 'Research and Development' category.
- Likewise, proper planning and a tight control on transportation & handling costs could minimise distribution costs.
These opportunities for cost reduction are unlikely to be foundwhen management focuses on maximising profit in a period-by-periodbasis. Only on knowing the lifecycle costs of a product can a business decide appropriately on its price. This, coupled with planning of the different phases of the product's life, could give rise to the following tactics:


 Customer lifecycle costing
Not all investment decisions involve large initial capital outflowsor the purchase of physical assets. The decision to serve and retaincustomers can also be a capital budgeting decision even though theinitial outlay may be small. For example a credit card company or aninsurance company will have to choose which customers they take on andthen register them on the company's records. The company incurs initialcosts due to the paperwork, checking creditworthiness, opening policies,etc. for new customers. It takes some time before these initial costsare recouped. Research has also shown that the longer a customer stayswith the company the more profitable that customer becomes to thecompany.
Thus it becomes important to retain customers, whether by goodservice, discounts, other benefits, etc. A customer's ‘life' can bediscounted and decisions made as to the value of, say, a‘five-year-old' customer. Eventually a point arises where profit nolonger continues to grow; this plateau is reached between about fiveyears and 20 years depending on the nature of the business. Therefore bystudying the increased revenue and decreased costs generated by an‘old' customer, management can find strategies to meet their needsbetter and to retain them.
Many manufacturing companies only supply a small number ofcustomers, say between six and ten, and so they can cost customersrelatively easily. Other companies such as banks and supermarkets havemany customers and cannot easily analyse every single customer. In thiscase similar customers are grouped together to form category types andthese can then be analysed in terms of profitability.
For example, the UK banks analyse customers in terms of fruits,such as oranges, lemons, plums, etc. Customers tend to move from onecategory to another as they age and as their financial habits change.Customers with large mortgages, for example, are more valuable to thebank than customers who do not have a large income and do not borrowmoney. Banks are not keen on keeping the latter type of customer.


 Test your understanding 6
The following details relate to a new product that has finished development and is about to be launched.
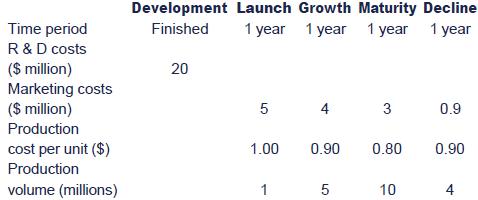
The launch price is proving a contentious issue between managers.The marketing manager is keen to start with a low price of around $8 togain new buyers and achieve target market share. The accountant isconcerned that this does not cover costs during the launch phase and hasproduced the following schedule to support this:
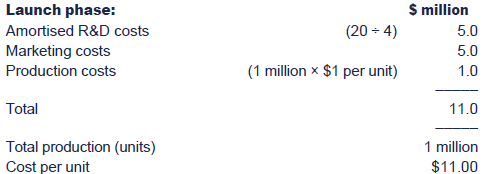
Prepare a revised cost per unit schedule looking atthe whole lifecycle and comment on the implications of this cost withregards to the pricing of the product during the launch phase.


 Lifecycle costing in the service industry
A service organisation will provide services that have life cycles.For example, a company leasing heavy machinery to clients could use LCCto predict the total costs, resources, utilisation and productivity foran asset over its entire life cycle : thus, LCC is an excellent toolfor assessing alternatives, which has made it very common in theprocurement of large assets.
All pertinent cash flows that go to form the complete service overthe life of the machine are important, and consideration should be givenin advance as to how to carry them out so as to minimise the whole-lifecost. A simple model is shown below :

The total cost of owning and operating the equipment is the sum ofthe individual cost elements. LCC also involves understanding the detailof the individual cost elements and building these up to the ultimatelife cycle cost. Then, each cost can be broken down further. Forexample, the ‘Parts and Materials' costs can be split as follows :
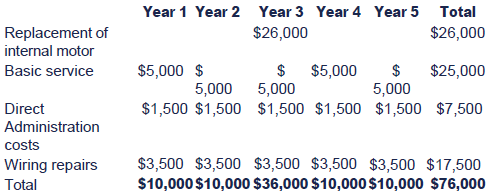
For example, the internal motor change is scheduled to occur inYear 3. This is driven by an estimated life of the motor of X hours andan expected utilisation of the equipment of Y hours per year. If X or Ywere to change, the model may provide a different result.
Assuming the LCC model above could be continuously updated, and thecomponent costs automatically uploaded every time a maintenance task isperformed, this would :
(1) Provide the company with more accurate and robust pricing information;
(2) Provide a real time life cycle cost model;
(3) Enable equipment managers to see and understand the impact of their decisions on the life cycle cost of the asset;
(4) Allow the company to see the forward resource for parts, labour and materials;
(5) Allow budgeting managers to plan cash outflows for the next 5 years and beyond.

9 Environmental management accounting
The importance of environmental management
Organisations are beginning to recognise that environmentalawareness and management are not optional, but are important forlong-term survival and profitability. All organisations:
- are faced with increasing legal and regulatory requirements relating to environmental management
- need to meet customers' needs and concerns relating to the environment
- need to demonstrate effective environmental management to maintain a good public image
- need to manage the risk and potential impact of environmental disasters
- can make cost savings by improved use of resources such as water and fuel
- are recognising the importance of sustainable development, which is the meeting of current needs without compromising the ability of future generations to meet their needs.
The contribution of environmental management accounting (EMA)
EMA is concerned with the accounting information needs of managersin relation to corporate activities that affect the environment as wellas environment-related impacts on the corporation. This includes:
- identifying and estimating the costs of environment-related activities
- identifying and separately monitoring the usage and cost of resources such as water, electricity and fuel and to enable costs to be reduced
- ensuring environmental considerations form a part of capital investment decisions
- assessing the likelihood and impact of environmental risks
- including environment-related indicators as part of routine performance monitoring
- benchmarking activities against environmental best practice.

 EM and effect on financial performance
There are a number of ways in which environmental issues can have an impact on the financial performance of organisations.
Improving revenue
Producing new products or services which meet the environmentalneeds or concerns of customers can lead to increased sales. It may alsobe possible to sell such products for a premium price. Improved salesmay also be a consequence of improving the reputation of the business.
It is possible that in the future, rather than good environmentalmanagement resulting in improved sales, poor management will lead tolosses. All businesses will be expected to meet a minimum standardrelated to environmental issues.
Cost reductions
Paying close attention to the use of resources can lead toreductions in cost. Often simple improvements in processes can lead tosignificant costs savings.
Increases in costs
There may be increases in some costs, for example the cost ofcomplying with legal and regulatory requirements, and additional coststo improve the environmental image of the organisation. However some ofthese costs may be offset by government grants and this expenditure maysave money in the long-term as measures taken may prevent future losses.
Costs of failure
Poor environmental management can result in significant costs, forexample the cost of clean-up and fines following an environmentaldisaster.


 Some EMA initiatives
Rolls-Royce Aerospace says up to a quarter of emissions canbe cut by changes in airframe design. It adds that changes in itsEnvironmentally Friendly Engine (EFE) programme will deliver up toanother fifth and the remainder of the 50 per cent target can be met bychanging the way the aircraft are operated.
Rolls are also developing fuel cell technology and alternatives tokerosene. A biofuel blended with kerosene will be used in one of thefour Rolls-Royce RB211-524s powering an Air New Zealand Boeing 747-400in the second half of 2008.
Another example of energy saving is McCain Foods, which buysan eighth of the UK's potatoes to make chips. It has cut itsPeterborough plant's CO2 footprint by two-thirds, says corporate affairsdirector Bill Bartlett. It invested £10m in three 3MW turbines to meet60 per cent of its annual electricity demand. McCain spent another£4.5m on a lagoon to catch the methane from fermenting waste water andparticulates, which generates another 10 per cent of the site'selectricity usage. It also wants to refine its used cooking oil, eitherfor its own vehicles fleet or for selling on. McCain want to become morecompetitive and more efficient.
The Hull factory of Smith & Nephew Wound Managementmakes single-use sterile wound dressings for injuries and operations. Itsaved £250,000 a year by replacing a large absorption chiller with avapour compression chiller. It also replaced four 500kW chillers with a‘ring main' run from one 1MW chiller for the whole factory; in winterthis runs at 250kW. Hull saved £50,000 by shutting down four of itseight compressors. These and other efforts have cut its energy use by 38per cent to 48m kWh a year, saving £2m since 2003, says S&N energyand utilities manager Marc Beaumont, who adds: “And there's stillmore to go at.†He says the main driver has been cost: “Energyprices are set to go only one way. If we can drive down costs we canincrease our profits.â€
St Gobain are leaders in the design; production anddistribution of materials for the construction; industrial and consumermarkets. They used to pay contractors £75 a tonne for someone to takeits cardboard away. Now it uses a baler that costs £238.33 a month torent, maintain, operate and power. The baler crushes the cardboard into500kg bales that it sells to a paper mill for £30 a tonne.
McLenaghan has a long list of sellable wastes, from mobilephones to scrap metal to cutting-wheels, thermocouples, cutting toolsand vending machine cups. They believe waste can be reused, reallocatedor put into a revenue stream.
Xerox has announced ‘green software' that allows itsmachines to spot pages with just a URL, banner, logo or legal jargon andrefuse to print them.
Canon advertising says its copiers' on-demand fixingtechnology saved seven million tonnes of CO2 between 1999 and 2006. Andin September 2007 Dell announced its aim to be carbon neutral.

10 Identifying and accounting for environmental costs
Internal and external environmental costs
Management are often unaware of the extent of environmental costsand cannot identify opportunities for cost savings. Environmental costscan be split into two categories:
Internal costs
These are costs that directly impact on the income statement of a company. There are many different types, for example:
- improved systems and checks in order to avoid penalties/fines
- waste disposal costs
- product take back costs (i.e. in the EU, for example, companies must provide facilities for customers to return items such as batteries, printer cartridges etc. for recycling. The seller of such items must bear the cost of these "take backs)
- regulatory costs such as taxes (e.g. companies with poor environmental management policies often have to bear a higher tax burden)
- upfront costs such as obtaining permits (e.g. for achieving certain levels of emissions)
- back-end costs such as decommissioning costs on project completion
External costs
These are costs that are imposed on society at large, but not borneby the company that generates the cost in the first instance. Forexample,
- carbon emissions
- usage of energy and water
- forest degradation
- health care costs
- social welfare costs
However, governments are becoming increasingly aware of theseexternal costs and are using taxes and regulations to convert them tointernal costs. For example, companies might have to have a treereplacement programme if they cause forest degradation, or they receivelower tax allowances on vehicles that cause a high degree of harm to theenvironment. On top of this, some companies are voluntarily convertingexternal costs to internal costs.
11 Other classifications
Other classifications include those from :
(1) Hansen and Mendoza:
(i)Environmental prevention costs: the costs of activities undertaken to prevent the production of waste.
(ii) Environmental detection costs:costs incurred to ensure that the organisation complies with regulationsand voluntary standards.
(iii)Environmental internal failurecosts: costs incurred from performing activities that have producedcontaminants and waste that have not been discharged into theenvironment.
(iv)Environmental external failure costs: costs incurred on activities performed after discharging waste into the environment.
(2) The US Environmental Protection Agency makes a distinction between four types of costs :
(i)Conventional costs : raw materials and energy costs having environmental relevance
(ii) Potentially hidden costs : costs captured by accounting systems but then losing their identity in 'general overheads'
(iii)Contingent costs : costs to be incurred at a future date, e.g. clean-up costs
(iv)Image and relationship costs : coststhat, by their nature, are intangible, for example the costs ofpreparing environmental reports.
(3) The United Nations Division for Sustainable Developmentdescribes environmental costs as comprising of costs incurred toprotect the environment (for example, measures taken to preventpollution) and costs of wasted material, capital and labour, ieinefficiencies in the production process.

 Further examples of environmental costs

12 EMA techniques
The most appropriate management accounting techniques for theidentification and allocation of environmental costs are thoseidentified by the United Nations Division for Sustainable Development.These include (Source : Student Accountant, Issue 15):
1. Input / outflow analysis
This technique records material inflows and balances this with outflowson the basis that what comes in, must go out.
For example, if 100kg of materials have been bought and only 80kgof materials have been produced, then the 20kg difference must beaccounted for in some way. It may be, for example, that 10% of it hasbeen sold as scrap and 90% of it is waste. By accounting for outputs inthis way, both in terms of physical quantities, and, at the end of theprocess, in monetary terms too, businesses are forced to focus onenvironmental costs.
2. Flow cost accounting
This technique uses not only material flows, but also theorganisational structure. It makes material flows transparent by lookingat the physical quantities involved, their costs and their value. Itdivides the material flows into three categories : material, system anddelivery and disposal. The values and costs of each of these three flowsare then calculated. The aim of flow cost accounting is to reduce thequantity of materials which, as well as having a positive effect on theenvironment, should have a positive effect on a business' total costs inthe long run.
3. Activity-based costing
ABC allocates internal costs to cost centres and cost drivers onthe basis of the activities that give rise to the costs. In anenvironmental accounting context, it distinguishes betweenenvironment-related costs, which can be attributed to joint costcentres, and environment-driven costs, which tend to be hidden ongeneral overheads.
4. Lifecycle costing
Within the context of environmental accounting, lifecycle costingis a technique which requires the full environmental consequences, and,therefore, costs, arising from the production of a product to be takenaccount across its whole lifecycle, literally ‘from cradle to grave'.
13 EMA : Advantages and disadvantages
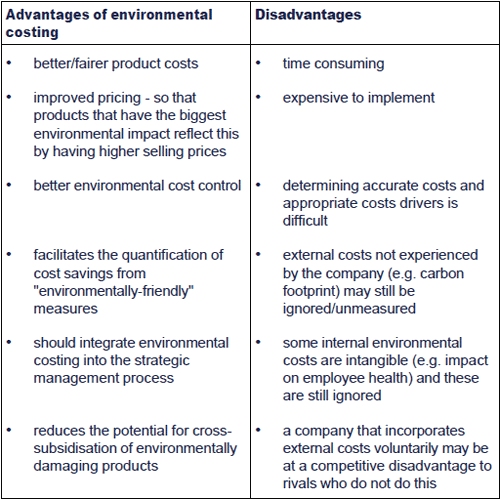
14 Chapter summary
Test your understanding answers

 Test your understanding 1
(a) Traditional absorption costing
(b) ABC
Workings


Note: In the example above the full production costs were:

(c) The reasons for the difference in the production cost per unit between the two methods
- The allocation of overheads under absorption costing was unfair. This method assumed that all of the overheads were driven by labour hours and, as a result, the Double Plus received 1.5 times the production overhead of the Plus.
- However, this method of absorption is not appropriate. The overheads are in fact driven by a number of different factors. There are five activity costs, each one has its own cost driver. By taking this into account we end up with a much more accurate production overhead cost per unit.
- Using ABC, the cost per unit of a Double Plus is significantly higher. This is because the Double Plus is a much more complex product than the Plus. For example, there are 140 orders for the Double Plus but only 10 for the Plus and there are 4 special parts for the Double Plus compared to only one for the Plus. As a result of this complexity, the Double Plus has received more than three times the overhead of the Plus.
- This accurate allocation is important because the production overhead is a large proportion of the overall cost.
(d) The implications of using ABC
- Pricing - pricing decisions will be improved because the price will be based on more accurate cost data.
- Decision making - this should also be improved. For example, research, production and sales effort can be directed towards the most profitable products.
- Performance management - should be improved. ABC can be used as the basis of budgeting and forward planning. The more realistic overhead should result in more accurate budgets and should improve the process of performance management. In addition, an improved understanding of what drives the overhead costs should result in steps being taken to reduce the overhead costs and hence an improvement in performance.
- Sales strategy - this should be more soundly based. For example, target customers with products that appeared unprofitable under absorption costing but are actually profitable, and vice versa.


 Test your understanding 2
Return per factory hour = ($85 – $42.50)/1.5 hours = $28.33
Cost per factory hour = $8,000/(10 × 40 hours) = $20
TPAR = $28.33/$20 = 1.4165


 Test your understanding 3
(a)
Step 1: Determine the bottleneck constraint.
The bottleneck resource is machine time. 400 machine hours available each week = 24,000 machine minutes.
Step 2: Calculate the throughput per unit for each product.

Step 3: Calculate the throughput per machine minute

Step 4: Rank

Step 5: Allocate resources using this ranking and answer the question.
The profit-maximising weekly output and sales volumes are as follows.
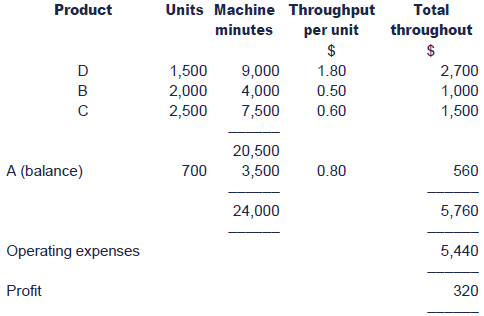
(b) Throughput per machine hour: $5,760/400 hours = $14.40
Cost (operating expenses) per machine hour: $5,440/400 hours = $13.60.
TPAR: $14.40/$13.60 = 1.059.


 Test your understanding 4
The information provided will give the following estimated product and company results:
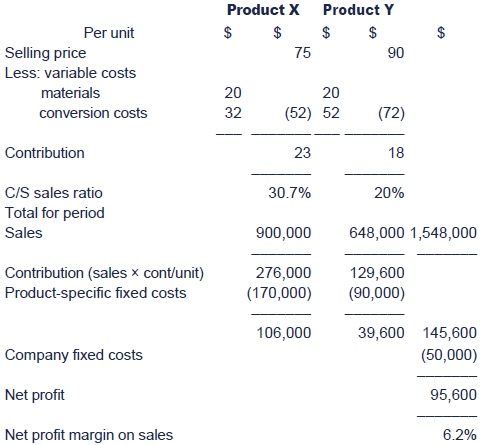
The company is falling considerably short of its 12% net profitmargin target. If sales quantities and prices remain unchanged, costsmust be reduced if the required return is to be reached.


 Test your understanding 5
Your answer may include:
- Simplification of the production process allowing cheaper unskilled labour to be used in place of more highly paid skilled labour.
- Using plastics instead of metal for components.
- Using less packaging – e.g. expensive boxes replaced with plastic sheaths.
- Sharing components between models can result in economies of scale. (This is widely used in the car industry and has helped to reduce costs dramatically.)
- Reduce stockholding costs through the introduction of a just-in-time system.
- Using cheaper overseas labour.


 Test your understanding 6
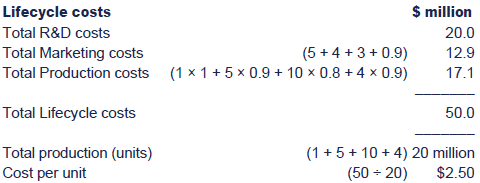
Comment
- The cost was calculated at $11 per unit during the launch phase. Based on this cost, the accountant was right to be concerned about the launch price being set at $8 per unit.
- However, looking at the whole life-cycle the marketing manager's proposal seems more reasonable.
- The average cost per unit over the entire life of the product is only $2.50 per unit. Therefore, a starting price of $8 per unit would seem reasonable and would result in a profit of $5.50 per unit.

|
Created at 5/24/2012 4:35 PM by System Account
(GMT) Greenwich Mean Time : Dublin, Edinburgh, Lisbon, London
|
Last modified at 5/25/2012 12:54 PM by System Account
(GMT) Greenwich Mean Time : Dublin, Edinburgh, Lisbon, London
|
|
|
|
 |
Rating
:
|
 Ratings & Comments
(Click the stars to rate the page) Ratings & Comments
(Click the stars to rate the page)
|
 |
Tags:
|
|
|
|
|