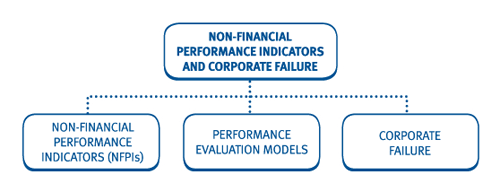
Chapter 10: Non-financial performance indicators and corporate failure
Chapter learning objectives
Upon completion of this chapter you will be able to:
- discuss the interaction of non-financial performance indicators with financial performance indicators
- discuss the implications of the growing emphasis on non-financial performance indicators
- discuss the significance of non-financial performance indicators in relation to employees
- identify and discuss the significance of non-financial performance indicators in relation to product/service quality, e.g. customer satisfaction reports, repeat business ratings, access and availability
- discuss the difficulties in interpreting data on qualitative issues
- discuss the significance of brand awareness and company profile and their potential impact on business performance
- evaluate the 'balanced scorecard' approach as a way in which to improve the range and linkage between performance measures
- evaluate the 'performance pyramid' as a way in which to link strategy, operations and performance
- evaluate the work of Fiitzgerald and Moon that considers performance measurement in business services using building blocks for dimensions, standards and rewards
- discuss and apply the Performance Prism
- assess the potential likelihood of corporate failure, utilising quantitative and qualitative performance measures
- assess and critique quantitative and qualitative corporate failure prediction models
- identify and discuss performance improvement strategies that may be adopted in order to prevent corporate failure
- discuss how long-term survival necessitates consideration of life-cycle issues
- identify and discuss operational changes to performance management systems required to implement the performance improvement strategies.
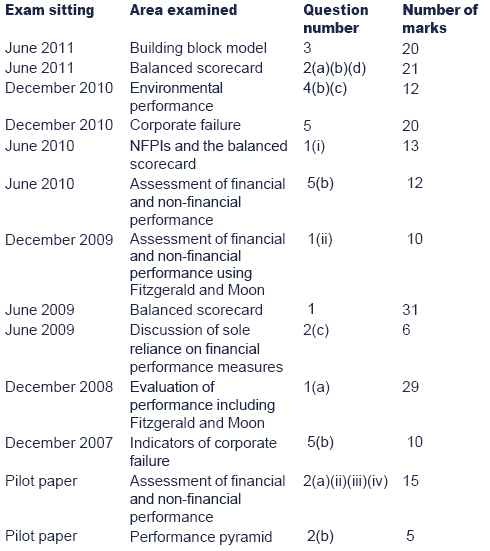
1 Exam focus
Student Accountant articles: visit the ACCA website, www.accaglobal.com, to review the following articles on the topics in this chapter:
- Business failure - July 2008
- The pyramids and pitfalls of performance measurement - September 2005
2 Introduction
Chapters 7, 8 and 9 have concentrated on financial performancemeasures. This chapter discusses the use on non-financial performanceindicators (NFPIs) and introduces some of the models that are availablefor evaluating financial and non-financial performance.
The final part of the chapter covers the separate topic of corporate failure.
Question focus: Many of the areas covered in this chapterhave already been touched upon in Paper F5. You may want to test yourassumed knowledge by completing Q18 from chapter 13.
3 Drawbacks of sole reliance on financial performance measures
As mentioned, so far we have concentrated on financial performancemeasures. However, there are a number of problems associated with theuse of financial performance indicators to monitor performance:
Short-termism
Linking rewards to financial performance may tempt managers to makedecisions that will improve short-term financial performance but mayhave a negative impact on long-term profitability. For example, amanager may decide to delay investment in order to boost the short-termprofits of their division.
Internal focus
Financial performance measures tend to have an internal focus. Inorder to compete successfully it is important that external factors(such as customer satisfaction and competitors' actions) are alsoconsidered.
Manipulation of results
In order to achieve target financial performance (and hence theirreward), managers may be tempted to manipulate results, e.g. costsrecorded in the current year may be wrongly recorded in the next year'saccounts in order to improve current year performance.
Do not convey the whole picture
The use of financial performance indicators has limited benefit tothe company since they do not convey the full picture regarding thefactors that drive long-term success and maximisation of shareholderwealth, e.g. customer satisfaction, ability to innovate, quality.
Backward looking
Financial performance measures are traditionally backward looking. This is not suitable in today's dynamic business environment.
4 Solution = use financial and non-financial performance indicators
In order to overcome the problems discussed in section 3, a broader range of measures should be used.
The optimum system for performance measurement and control will include:
- Financial performance indicators (FPIs) - it is still important to monitor financial performance, e.g. using ROCE, EBITDA, EVA.
- Non-financial performance indicators (NFPIs) - these measures will reflect the long-term viability and health of the organisation.
The models used to evaluate financial and non-financial performance will be reviewed in section 7.

 FPIs and NFPIs
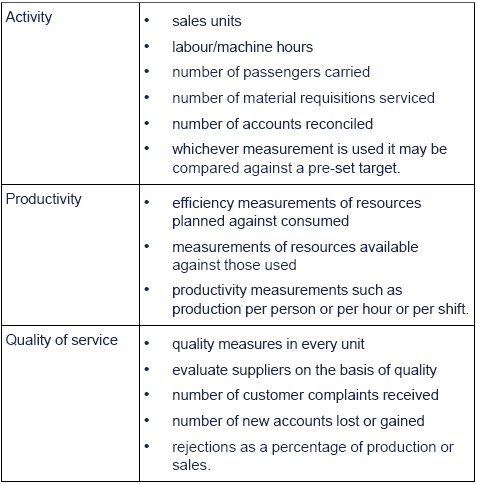
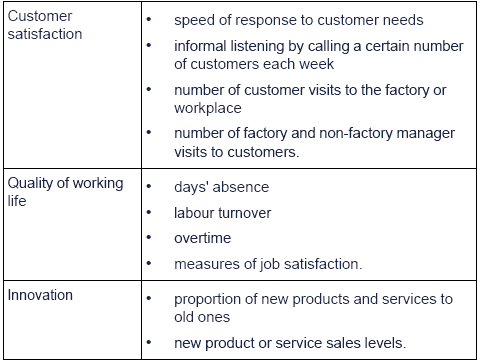
The following table gives examples of possible FPIs and NFPIs:


5 NFPIs and business performance
5.1 Introduction
There are a number of areas that are particularly important forensuring the success of a business and where the use of NFPIs plays akey role. These include:
- the management of human resources
- product and service quality
- brand awareness and company profile.
Each of these will be reviewed in turn.
5.2 The management of human resources
- Traditionally the main performance measure for staff was cost (a FPI).
- However, businesses have started to view staff as a major asset and recognise that it is important to attract, motivate and retain highly qualified and experienced staff.
- As a result, NFPIs are now also used to monitor and control staff.

 Test your understanding 1
Discuss, with reasons, two non-financial performance indicators that can be used to monitor and control employees.

5.3 Product and service quality
Problems with product or service quality can have a long-termimpact on the business and they can lead to customer dissatisfaction andloss of future sales.

 Product and service quality
- A product (or service) and its components should be critically and objectively compared both with competition and with customer expectation and needs, for example:
- Is it good value?
- Can it really deliver superior performance?
- How does it compare with competitor offerings?
- How will it compare with competitor offerings in the future given competitive innovations?
- Product and service quality are usually based on several critical dimensions that should be identified and measured over time. Performance on all these dimensions needs to be combined to give a complete picture. For example:
- an automobile firm can have measures of defects, ability to perform to specifications, durability and ability to repair
- a bank might be concerned with waiting time, accuracy of transactions, and making the customer experience friendly and positive
- a computer manufacturer can examine relative performance specifications, and product reliability as reflected by repair data.
- The relative importance of different factors will vary from company to company and between customers, but achieving high quality means ensuring all the factors of the product or service package meet customer requirements.
- Measures should be tracked over time and compared with those of competitors. It is the relative comparisons and changes that are most important.
- One of the most important assets of many firms is the loyalty of the customer base. Measures of sales and market share are useful but are crude indicators of how customers really feel about a firm.
- Often the most sensitive and insightful information comes from those who have decided to leave a brand or firm. Thus, 'exit interviews' for dissatisfied customers who have 'left' a brand can be very productive.
- Another key area is access and availability of products and services, as failure in these areas can cause a loss of customers.
- Other possible sources of non-financial information related to product and service quality and customer satisfaction are:
- repeat business ratings, which is useful as a complement to measurements of absolute sales.
- general customer satisfaction surveys.
- monitoring of complaints both in terms of numbers and type of complaint.


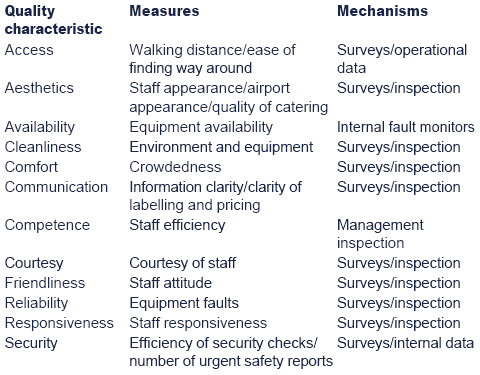
 Illustration 1 - BAA plc's service quality
BAA (the former state owned British Airports Authority) usesregular customer surveys for measuring customer perceptions of a widevariety of service quality attributes, including, for example, thecleanliness of its facilities, the helpfulness of its staff and the easeof finding one's way around the airport. Public correspondence is alsoanalysed in detail, and comment cards are available in the terminals sothat passengers can comment voluntarily on service levels received. Dutyterminal managers also sample the services and goods offered by outletsin the terminals, assessing them from a customer perspective.
They check the cleanliness and condition of service facilities andcomplete detailed checklists which are submitted daily to seniorterminal managers. The company has also a wealth of internal monitoringsystems that record equipment faults and failures, and report equipmentand staff availability. These systems are supported by the terminalmanagers who circulate the terminals on a full-time basis, helpingcustomers as necessary, reporting any equipment faults observed andmaking routine assessments of the level of service provided by BAA andits concessionaires.
BAA plc

5.4 Brand awareness and company profile
Developing and maintaining a brand and/or a company profile can beexpensive. However, it can also enhance performance. The value of abrand/company profile is based on the extent to which it has:
- high loyalty
- name awareness
- perceived quality
- other attributes such as patents or trademarks.
NFPIs may focus on areas such as customer awareness and consumer opinions.

 Brand awareness and company profile
- If potential customers do not know about a company, they will not purchase from it. Therefore, one of the main goals of any business should be to build brand awareness.
- Assessment of brand awareness means identifying the product or company's associations in the minds of customers, and its perceived quality. This is related to but can be very different from actual quality – but ultimately it is the consumer who decides what a brand is really worth.
- Associations can be monitored in an effective way by talking to groups of customers informally on a regular basis. The identification of changes in important associations is likely to emerge from such efforts. More structured tools are also available.
- A brand or firm can be scaled on its key dimensions using a representative sample of customers. Key dimensions can then be tracked over time.
- For companies with a high company profile it is particularly important that brand awareness is positive.
- Measures of brand awareness can either look at the direct link between the brand and overall results, e.g. by considering the price premiums which the company obtains, or monitor the more intangible aspects such as awareness and consumer opinion.


 Test your understanding 2
How are the measures of product and service quality related to brand awareness and company profile?

6 Difficulties in using and interpreting qualitative data
Most NFPIs are in non-financial terms. In section 5 of chapter 6 wediscussed the difficulties in recording and processing data of aqualitative nature and looked at how a business can deal withqualitative data.

 Qualitative data
Difficulties in using and interpreting qualitative information
Particularly at higher levels of management, non-financialinformation is often not in numerical terms, but qualitative, or soft,rather than quantitative. Qualitative information often representsopinions of individuals and user groups. However there are issuesrelated to its use.
- Decisions often appear to have been made on the basis of quantitative information; however qualitative considerations often influence the final choice, even if this is not explicit.
- Conventional information systems are usually designed to carry quantitative information and are sometimes less able to convey qualitative issues. However the impact of a decreased output requirement on staff morale is something that may be critical but it is not something that an information system would automatically report.
- In both decision making and control, managers should be aware that an information system may provide a limited or distorted picture of what is actually happening. In many situations, sensitivity has to be used in interpreting the output of an information system.
- Information in the form of opinions is difficult to measure and interpret. It also requires more analysis.
- Qualitative information may be incomplete.
- Qualitative aspects are often interdependent and it can be difficult to separate the impact of different factors.
- Evaluating qualitative information is subjective, as it is not in terms of numbers – there are no objective formulae as there are with financial measures.
- The cost of collecting and improving qualitative information may be very high.
- Difficulties in measurement and interpretation mean that qualitative factors are often ignored.
Working with qualitative information
Despite the challenges it presents, there may be ways of improving the use of qualitative information.
- Where it is important to make use of qualitative information, it is essential to ensure that users are aware of any assumptions made in analysis and of the difficulties involved in measuring and counting it.
- It is sometimes possible to quantify issues which are initially qualitative, by looking at its impact, e.g. when looking at service quality, considering the cost of obtaining the same quality of service elsewhere.
- Even if it is not possible to quantify issues precisely, attempting to do so is likely to improve decision making as the issues are likely to have been thought through more thoroughly.


 Test your understanding 3
Your company is considering replacing its currentproducts with a new range which will use different productiontechniques. What qualitative issues will you need to consider?

7 Models for evaluating financial and non-financial performance
7.1 Introduction
As discussed, it is important that a business appraises bothfinancial and non-financial performance. There are three key toolsavailable:
- Kaplan and Norton's balanced scorecard
- The performance pyramid
- Fitzgerald and Moon's building block model
- The performance prism
Each of these will be reviewed in turn.
The benefits of these models are as follows:
- financial and non-financial performance measures are included
- they are linked in to corporate strategy
- include external as well as internal measures
- include all important factors regardless of how easy they are to measure
- show clearly the tradeoffs between different dimensions of performance
- show how measures will motivate managers and employees.
7.2 Kaplan and Norton's balanced scorecard
What is the balanced scorecard?
The balanced scorecard includes financial measures (these revealthe results of actions already taken) and non-financial measures (theseare drivers of future financial performance). It includes external aswell as internal information.
The balanced scorecard allows managers to look at the business from four important perspectives:
Within each of these perspectives a business should seek toidentify a series of goals (CSFs) and measures (KPIs). These should bein line with the overall strategic objectives and vision of theorganisation.

 Illustration 2 – Examples of goals and measures
A balanced scorecard for an electronics company could include the following goals and measures:
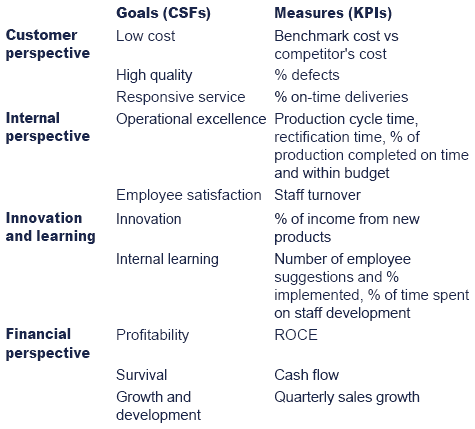
It would be beneficial to rank the goals and measures in order of importance.


 Test your understanding 4
Suggest some performance measures for a buildingcompany involved in house building and commercial property and operatingin a number of different countries.


 Test your understanding 5
Discuss the disadvantages of the balanced scorecard.

Implementing the balanced scorecard
There are four essential activities which have to be executedrigorously if the implementation of the balanced scorecard is tosucceed:

 Steps involved in implementing the scorecard
The steps in implementing the balanced scorecard
(1)Make the strategy explicit
The starting point in producing a balanced scorecard isidentifying the strategic requirements for success in the firm.Typically, those strategic requirements will relate to products,markets, growth and resources (human, intellectual and capital).
For example, businesses like Dell may want to be low-costproducers achieving competitive advantage from selling undifferentiatedproducts at lower prices than those of competitors, or a business mayhave a product development strategy to become a leader in technology andcommand a premium like Apple. Their strategy may also be to develop andmaintain market share, like Microsoft, or their strategy may be tooccupy the number-one or number-two position in their lines of business.
(2)Choose the measures
Performance measures have to be selected that clearly relate tothe achievement of the strategies identified in the earlier process. Ashas been seen throughout the discussion of performance measures in thistext, the selection of appropriate indicators and measures is critical.The selected measures form the goals that management communicates tostaff as being important. Those goals are what staff will strive toachieve. If the wrong goals are selected then the firm may find itselfdoing the wrong things.
The general problem is that performance measures that relate tolimited parts of the business can be very prone to inducingdysfunctional behaviour. For example, a firm might minimise itsinventory holding in order to meet some inventory holding target – butat the expense of total operating costs.
(3)Define and refine
Management reporting systems and procedures need to be set up totrack and report the measures regularly. This involves all the issuesrelating to the processing of data and the reporting of informationdiscussed earlier in this text.
The precise requirements of reporting associated with the use ofthe balanced scorecard will make demands on both the managementaccounting and IT systems in an organisation. Fully satisfying thosedemands has a cost and sometimes compromises may have to be made inorder to contain that cost.
All sorts of practical problems may be encountered in reporting on an indicator. For example, when reporting on revenue:
- How is revenue calculated and when is it recorded?
- Should it include the non-core business activity?
- Should revenue be reported under product, region or customer headings?
- How should interdivisional transactions be reported?
Operating the management accounting system associated with thebalanced scorecard requires that the things being reported should bedefined and periodically refined.
(4)Deal with people
The balanced scorecard is an exercise in modifying humanbehaviour. It is its interaction with people that determines whether ornot it will work.
Balanced scorecards can easily become a confusing mass ofmeasures, some of which even contradict each other. There may be toomany measures and action to achieve some of them may contribute tofailure to achieve others. The measures may not always be prioritised.
To be effective, the measures contained in the scorecard shouldbe limited in number, reasonably consistent and ranked in some order ofpriority. Further, performance measures should be aligned with themanagement structure. Career progression and remuneration should beappropriately linked to scorecard measure linked performance.Organisations which adopt a balanced scorecard but continue to rewardmanagers on the basis of a narrow range of traditional financialmeasures are likely to be disappointed by the results.


 Practical example of scorecard implementation
One example reported in management literature of how the balancedscorecard might be applied is the US case of Analog Devices (asemi-conductor manufacturer) in the preparation of its five-yearstrategic plan for 1998-1992.
Analog Devices had as its main corporate objective: 'Achieving ourgoals for growth, profits, market share and quality creates theenvironment and economic means to satisfy the needs of our employees,stockholders, customers and others associated with the firm. Our successdepends on people who understand the interdependence and congruence oftheir personal goals with those of the company and who are thusmotivated to contribute towards the achievement of those goals.'
Three basic strategic objectives identified by the company were market leadership, sales growth and profitability.
The company adopted targets as follows:
Customer perspective
- Percentage of orders delivered on time: a target was set for the five-year period to increase the percentage of on-time deliveries from 85% to at least 99.8%.
- Outgoing defect levels: the target was to reduce the number of defects in product items delivered to customers, from 500 per month to fewer than 10 per month.
- Order lead time: a target was set to reduce the time between receiving a customer order to delivery from 10 weeks to less than three weeks.
Internal perspective
- Manufacturing cycle time: to reduce this from 15 weeks to 4 to 5 weeks over the five-year planning period.
- Defective items in production: to reduce defects in production from 5,000 per month to fewer than 10 per month.
Learning and innovation perspective
- Having products rated 'number one' by at least 50% of customers, based on their attitudes to whether the company was making the right products, performance, price, reliability, quality, delivery, lead time, customer support, responsiveness, willingness to co-operate and willingness to form partnerships.
- The number of new products introduced to the market.
- Sales revenue from new products.
- The new product sales ratio: this was the percentage of total sales achieved by products introduced to the market within the previous six quarters.
- Average annual revenues for new products in their third year.
- Reducing the average time to bring new product ideas to market.
Financial targets were set for revenue, revenue growth, profit andreturn on assets, but the idea was that the financial targets would flowfrom achieving the other targets stated above.
Analog Devices sought to adopt financial and non-financialperformance measures within a single system, in which the varioustargets were consistent with each other and were in no way incompatible.


 Test your understanding 6
JMP is a privately owned IT company. They employ various ITspecialists and technical engineers who specialise in (VOIP) Voice OverInternet Protocol.
JMP has established a good reputation for competitive prices, yetgood quality and performance, but has less than 1% of the market in thissector and faces stiff competition especially in the internal markets,which has grown from $3 billion to $8 billion in the last seven years.
The Managing Director has become increasing concerned about one ofits main customers who account for 40% of it's sales. Also JMP'sinabilities to recruit high calibre staff, identify market trends, scanits competitive environments and create marketing strategies and plans.
Financial data:
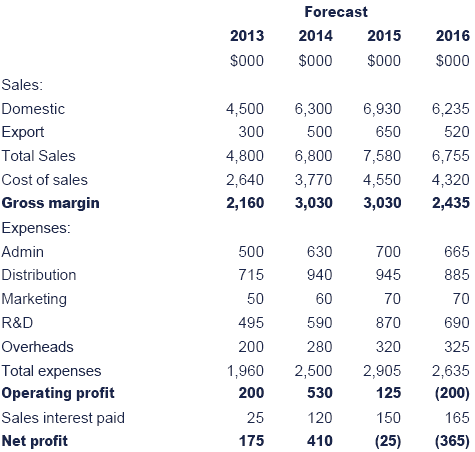
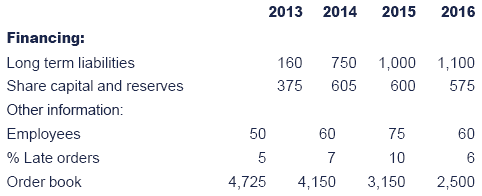
Required:
Using the above financial and qualitative data provide:
- a financial analysis of JMP, highlighting any problem areas and
- apply the balance scorecard.


 Strategy mapping
Strategy mapping was developed by Kaplan and Norton as an extensionto the balanced scorecard and to make implementations of the scorecardmore successful.
The steps involved are:
- At the head of the strategy map is the overriding objective of the organisation which describes how it creates value. This is then connected to the organisation's other objectives, categorised in terms of the four perspectives of the balanced scorecard, showing the cause-and-effect relationships between them.
- The strategy map helps organisations to clarify, describe and communicate the strategy and objectives, both within the organisation and to external stakeholders by presenting the key relationships between the overall objective and the supporting strategy and objectives in one diagram.
Issues when implementing the strategy map:
- Organisations have often found it difficult to translate the corporate vision into behaviour and actions which achieve the key corporate objectives.
- In practice, many employees do not understand the organisation's strategy, and systems such as performance management and budgeting are not linked to the strategy.

7.3 Performance pyramid
- The performance pyramid, developed by Lynch and Cross, includes a hierarchy of financial and non-financial performance measures.
- The diagram below shows actions to assist in the achievement of corporate vision may be cascaded down through a number of levels, i.e. it shows the link between strategy and day to day operations.
Level 1: At the top of the organisation is the corporatevision through which the organisation describes how it will achievelong-term success and competitive advantage.
Level 2: This focuses on the achievement of anorganisation's CSFs in terms of market-related measures and financialmeasures. The marketing and financial success of a proposal is theinitial focus for the achievement of corporate vision.
Level 3: The marketing and financial strategies set at level2 must be linked to the achievement of customer satisfaction, increasedflexibility and high productivity at the next level. These are theguiding forces that drive the strategic objectives of the organisation.
Level 4: The status of the level 3 driving forces can bemonitored using the lower level departmental indicators of quality,delivery, cycle time and waste.
The left hand side of the pyramid contains measures which have anexternal focus and which are predominantly non-financial. Those on theright are focused on the internal efficiency of the organisation and arepredominantly financial.

 Test your understanding 7
Suggest two measures (KPIs) for each of the three categoriesat the the business operating systems level, i.e. customersatisfaction, flexibility and productivity.

The one drawback of the performance pyramid is that it doestend to concentrate on two groups of stakeholders, i.e. shareholders andcustomers. It is necessary to ensure that measures are included whichrelate to other stakeholders as well.
7.4 Fitzgerald and Moon's building block model
Fitzgerald and Moon have developed an approach to performancemeasurement in business services that is based on the three buildingblocks of dimensions, standards and rewards.
Dimensions
The dimensions are the goals, i.e. the CSFs for the business andsuitable measures must be developed to measure each performancedimension. For example:
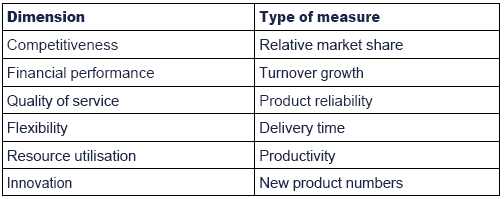

 Dimensions of performance
The table above identifies the dimensions of performance. The firsttwo of these relate to downstream results, the other four to upstreamdeterminants. For example, a new product innovation will not impact onprofit, cash flow and market share achieved in the past – but a highlevel of innovation provides an indicator of how profit, cash flow andmarket share will move in the future. If innovation is the driver ordeterminant of future performance, it is a key success factor.

Standards
The standards set, i.e. the KPIs, should have the following characteristics:
- Ownership: Managers who participate in the setting of standards are more likely to accept and be motivated by the standards than managers on whom standards are imposed.
- Achievability: An achievable, but challenging, standard is a better motivator than an unachievable one.
- Fairness: When setting standards across an organisation, care should be undertaken to ensure that all managers have equally challenging standards.
Rewards
To ensure that employees are motivated to meet standards, the standards need to be clear (e.g. the target is to 'achieve four product innovations per year' rather than to simply 'innovate') and linked to controllable factors. The actual means of motivation may involve performance related pay, a bonus or a promotion.

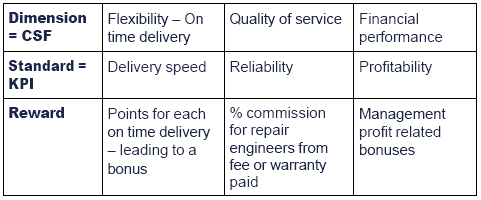
 Fitzgerald and moon example
Fitzgerald and Moon applied to a Washing Machine Manufacturer:


 Test your understanding 8
FL Ltd provides training on financial subjects to staff of smalland medium-sized businesses. Training is at one of two levels – forclerical staff, instructing them on how to use simple financialaccounting computer packages, and for management, on managementaccounting and financial management issues.
Training consists of tutorial assistance, in the form of workshopsor lectures, and the provision of related material – software, textsand printed notes.
Tuition days may be of standard format and content, or designed tomeet the client's particular specifications. All courses are run onclient premises and, in the case of clerical training courses, arelimited to 8 participants per course.
FL Ltd has recently introduced a 'helpline' service, which allowscourse participants to phone in with any problems or queries arisingafter course attendance. This is offered free of charge.
FL Ltd employs administrative and management staff. Courselecturers are hired as required, although a small core of technicalstaff is employed on a part-time basis by FL Ltd to preparecustomer-specific course material and to man the helpline.
Material for standard courses is bought in from a group company, who also print up the customer-specific course material.
Suggest a measure for each of the performance criteria listed below:
- financial performance
- competitiveness
- quality of service
- flexibility
- resource utilisation
- innovation.

Advantages of the building block model
- All key determinants of success in performance will be measured.
- Targets are set in such a way to engage and motivate staff, i.e. through ownership, achievability and fairness.
7.5 The Performance Prism
What is the Performance Prism?
- The Performance Prism is an approach to performance management which aims to effectively meet the needs and requirements of all stakeholders. This is in contrast with the performance pyramid which tends to concentrate on customers and shareholders and is also in contrast with value based management (covered in chapter 7) which prioritises the needs of shareholders.
- It takes stakeholder requirements as the start point for the development of performance measures rather than the strategy of the organisation.
- It recognises the need to work with stakeholders to ensure that their needs are met.
The framework
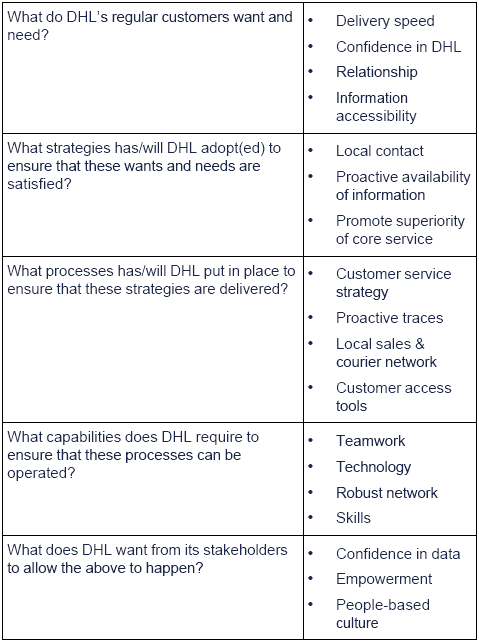
The Performance Prism poses five questions. The answers to thesequestions form the starting point for defining performance measures.

 Illustration 3 - The Performance Prism at DHL
Example of application of the performance prism at DHL


 Test your understanding 9
Phoenix Fund Management (PFM) has been responsible for theinvestment of pension and life insurance funds for the past twentyyears. It claims to be a 'fund manager with a difference' by seeking togain active involvement in under-performing or poorly managedbusinesses. PFM requires that companies it has invested in be run in thelong-term interests of the shareholders. PFM assesses such companies interms of communication, financial, strategic and ethical performanceagainst certain principles it has developed. (For instance, onefinancial principle is that 'companies should have performanceevaluation and incentive systems to provide managers with an incentiveto deliver long term shareholder value').
PFM's belief is that there is a lack of 'real' accountabilitybetween boards of directors and shareholders and that too oftenshareholders concentrate on short-term financial gains. PFM argues thatif other investors believe that a company is poorly run they merely selltheir shares and invest elsewhere. Thus boards of directors are notheld properly to account over poor performance. Where it believescompanies it invests in are under-performing, PFM enters into dialoguewith the board and seeks changes in practice. PFM is increasingly beingrecognised as a major driver of change in corporate life.
Explain how the Performance Prism can assistcompanies in developing performance management indicators which takeaccount of the needs of stakeholders such as PFM.

8 Corporate failure
8.1 Introduction
Corporate failure occurs when a company cannot achieve a satisfactory return on capital over the longer-term.
If unchecked, the situation is likely to lead to an inability of the company to pay its obligations as they become due.
The company may still have an excess of assets over liabilities,but if it is unable to convert those assets into cash it will beinsolvent.

 Test your understanding 10
Identify some of the reasons for corporate failure.


 Why do companies fail?
Reasons include:
(1)Failing to adapt to changes in the environment
Reasons for failing to adapt include:
- complacency
- risk-averse decision making
- economies of production and administration
- limited opportunities for innovation and diversification
- limited mental models.
Complacency is a charge frequently levelled at managers, and thereare, no doubt, occasions when senior managers convince themselves thateverything is fine, when it is not. However, the charge is frequentlymade with the benefit of hindsight, rather than observation of theefforts made by those managers at the time. There are several entirelysensible reasons why managers are reluctant to make large strategicchanges.
First, it is not possible to quantify the risks of making a majorchange. Several studies have shown that predicting changes in theenvironment and devising appropriate counter-measures is among the mostdifficult things a manager is required to do. Only in hindsight are thedynamics clear. It is worth remembering that case studies are writtenbackwards, where a known outcome is traced back to its origins.
Faced with such difficulties, managers are reluctant to makelarge-scale changes that might risk increasing the problems, and mightbe very difficult to implement adequately. Rather, they select optionsof relatively limited impact – a process referred to as logicalincrementalism.
Secondly, changes to production can reduce the opportunities foreconomies of scale, and raise the firm's cost base. There is always atemptation to try to retain share, by reducing price, rather than makefundamental changes to a product of its method of production and riskescalating costs.
Thirdly, it may be that management is entirely aware that thestrategic situation is worsening, but be unable to see opportunities toinnovate or diversify out of trouble. It must be accepted that there aresituations where there are no feasible solutions, and there might bebetter uses of the shareholders' funds than attempts to turn thebusiness round.
Finally, a large part of the problem is caused by the mental modelsof those who have control of the strategy within an organisation. Amental model is the way that individuals think about problems andissues. We look (below) at Johnson's notion of strategic drift, wherethe firm's mental models stop the company from changing quickly enoughto keep up with environmental change.
(2)Strategic drift
Strategic drift is a term devised by Johnson (1988) todescribe as a warning to those who champion the idea of strategyemerging as a series of logical, incremental steps. Johnson argues thatthis limits the rate of change to the speed at which management mightfeel comfortable, which has many advantages (particularly inimplementation), but might be inappropriate in periods when theenvironment moves very quickly.
As outlined above, the organisation takes a series of logical,incremental steps that enables it to change ahead of the market,developing a competitive advantage. However, the rate of change in themarket place speeds up, and the firm's incrementalist approach is notenough to maintain its advantage, and it is left behind. At this point,the firm must abandon the approach, and adopt radical, discontinuouschange in order to stay with the market leaders.
Johnson's main argument is that the reasons for failing to increasethe tempo of change are largely cultural, rather than technical. Heargues that the corporate paradigm, as revealed by its cultural web anddescribed in an earlier chapter, is the biggest constraint on strategicthinking and action. It is important to see that management cannotchange a corporate paradigm, partly because they are themselves caughtup in it, and partly because some elements of it are not amenable tomanagement techniques. Logical incrementalism is successful because itdoes not challenge the underlying paradigm, allowing change to takeplace relatively smoothly. More revolutionary change must damage theparadigm before it can begin.

8.2 Assessing the likelihood of failure
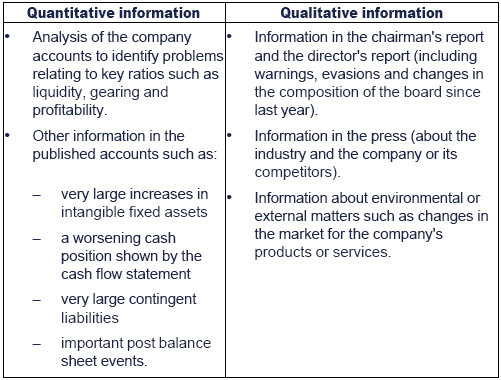
The following information can be used when assessing the likelihood of corporate failure:

 Test your understanding 11
You have been asked to investigate a chain ofconvenience stores and assess the likelihood of corporate failure. Whatwould you include in your analysis?


 Additional example
Insureme was the market leader in home and motor vehicle insurancewith a 28% market share. The company has lost its market share over thelast two years and this may lead to the demise of the company.
Required:
Discuss five performance indicators, other than decreasing marketshare, which might indicate Insureme might fail as a corporate entity.
Solution:
Poor cash flow
Poor cash flow might render an organisation unable to pay its debtsas and when they fall due for payment. This might mean, for example,that providers of finance might be able to invoke the terms of a loancovenant and commence legal action against an organisation which mighteventually lead to its winding-up.
Lack of new production/service introduction
Innovation can often be seen to be the difference between 'life anddeath' as new products and services provide continuity of incomestreams in an ever-changing business environment. A lack of newproduct/service introduction may arise from a shortage of fundsavailable for re-investment. This can lead to organisations attemptingto compete with their competitors with an out of date range of productsand services, the consequences of which will invariably turn out to bedisastrous.
General economic conditions
Falling demand and increasing interest rates can precipitate thedemise of organisations. Highly geared organisations will suffer asdemand falls and the weight of the interest burden increases.Organisations can find themselves in a vicious circle as increasingamounts of interest payable are paid from diminishing gross marginsleading to falling profits/increasing losses and negative cash flows.This leads to the need for further loan finance and even higher interestburden, further diminution in margins and so on.
Lack of financial controls
The absence of sound financial controls has proven costly to manyorganisations. In extreme circumstances it can lead to outright fraud(e.g. Enron and WorldCom).
Internal rivalry
The extent of internal rivalry that exists within an organisationcan prove to be of critical significance to an organisation asmanagerial effort is effectively channeled into increasing the amount ofinternal conflict that exists to the detriment of the organisation as awhole. Unfortunately the adverse consequences of internal rivalryremain latent until it is too late to redress them.
Loss of key personnel
In certain types of organisation the loss of key personnel can'spell the beginning of the end' for an organisation. This isparticularly the case when individuals possess knowledge which can beexploited by direct competitors, e.g. sales contacts, productspecifications, product recipes, etc.

8.3 Corporate failure prediction models
Quantitative models
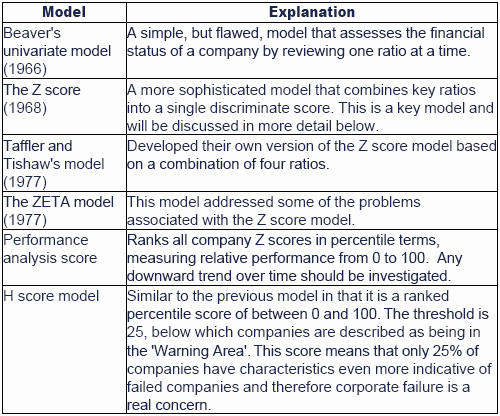
Calculating a Z score
The Z score is generated by calculating five ratios, which are thenmultiplied by a pre-determined weighting factor and added together toproduce the Z score. The formula is:
Z score = 1.2X1+ 1.4X2 + 3.3X3 + 0.6X4 + 1.0X5
Where:
X1 = working capital/total assets
X2 = retained earnings/total assets
X3 = earnings before interest and tax/total assets
X4 = market value of equity/total liabilities
X5 = sales/total assets
The score indicates the likelihood of failure:
- Less that 1.81 - companies with a Z score of below 1.81 are in danger and possibly heading towards bankruptcy
- Between 1.81 and 2.99 - companies with scores between 1.81 and 2.99 need further investigation.
- 3 or above - companies with a score of 3 or above are financially sound.

 Test your understanding 12
Using the data below calculate the Z score for each of the four companies and comment on your findings.


Limitations of quantitative models include:
- The score estimated is a snapshot.
- Further analysis is needed to fully understand the situation, e.g. cash flow projections, detailed cost information, environmental review.
- Scores are only good predictors in the short-term.
- Figures are open to manipulation.
- The Z score model only gives guidance below the danger level of 1.81. Further investigation is needed for those organisations with scores between 1.81 and 2.99.
Qualitative models - Argenti's A score
The most notable qualitative model is Argenti's A score model.
Argenti suggested that the failure process follows a predictable sequence:
(1) Defects - include management weaknesses (such as anautocratic chief executive) and accounting deficiencies (such as nobudgetary control). Each defect is given a score. A mark of 10 or moreout of a possible 45 is considered unsatisfactory.
(2) Mistakes - will occur over time as a result of thedefects above. Mistakes include high gearing, overtrading or failure of abig project. A score of more than 15 out of a possible 45 is consideredunsatisfactory.
(3) Symptoms of failure - mistakes will eventually lead to visible symptoms of failure, e.g. deteriorating ratios or creative accounting.
If the overall score is more than 25 the company has many of the signs preceding failure and is therefore a cause for concern.
Limitations of qualitative models include:
- Based on the subjective judgement of experts (also a strength).
- Requires a large amount of financial and non-financial information (also a strength).
- Results are only as good as inputs into them.
8.4 Performance improvement strategies
The key to preventing corporate failure is to spot the warning signs early, and take corrective action quickly.
- The actions needed will depend on the particular situation. Once the signs of impending failure are seen, it is important to investigate and identify the causes.
- These may be related to a range of different functions within the business, such as financial management, marketing or production.
- It may sometimes be necessary to seek external advice to help to identify the problem.
- It is important that the managers of the business accept that there is a problem and that mistakes have been made and to move on to a solution, rather than apportioning blame.
- Actions may involve major strategic change, such as getting out of a loss-making business, or making changes to the way operations are managed, such as changes to production management.
- The action needed may include putting in controls to prevent further loss.
- The best strategy to prevent failure is to have effective management systems in place to begin with.
The performance management system will need to reflect the performance improvement strategies:
- a link should be established between the new strategic goals and CSFs
- performance targets should be set at all levels and these should relate to the achievement of strategic objectives
- continuous review of actual performance against targets will be required
- additional training and development needs must be met.

 Test your understanding 13
You have been asked to recommend actions which need to be taken toprevent failure of an electronics manufacturer which is in financialdifficulties. On investigation, you ascertain that the company has beenmaking losses for the last two years. Although the product is wellthought of in the market, sales are decreasing slightly. Returns andcustomer complaints are high. The manufacturing time for the products is30 days and raw materials inventories are generally held for two weeks.There are also high levels of finished goods inventories. Receivablesdays are 100.
Required:
What actions do you suggest should be taken?

Question focus: now attempt question 19 from chapter 13
8.5 Long-term survival and the product life cycle

 Classic life cycle
The 'classic' life cycle for a product has four phases, with different CSFs.
- An introduction phase, when the product or service is first developed and introduced to the market. Sales demand is low whilst potential customers learn about the item. There is a learning process for both customers and the producer, and the producer might have to vary the features of the product or service, in order to meet customer requirements more successfully.
- A growth phase, when the product or service becomes established and there is a large growth in sales demand. The number of competitors in the market also increases, but customers are willing to pay reasonably high prices. The product becomes profitable. Variety in the product or service increases, and customers are much more conscious of quality issues.
- A maturity phase, which might be the longest stage in the product life cycle. Demand stabilises, and producers compete on price.
- A decline phase, during which sales demand falls. Prices are reduced to sustain demand and to slow the decline in sales volume. Eventually the product becomes unprofitable, and producers stop making it.

Long-term survival necessitates consideration of life-cycle issues:
Issue 1: There will be different CSFs at different stages ofthe life cycle. In order to ensure that performance is managedeffectively KPIs will need to vary over different stages of the lifecycle.
Issue 2: The stages of the life cycle have different intrinsic levels of risk:
- The introduction period is clearly a time of high business risk as it is quite possible that the product will fail.
- The risk is still quite high during the growth phase because the ultimate size of the industry is still unknown and the level of market share that can be gained and retained is also uncertain.
- During the maturity phase the risk decreases and the final phase should be regarded as low risk because the organisation knows that the product is in decline and its strategy should be tailored accordingly.
Understanding and responding to these risks is vital for the future success of the organisation.
If there is an analysis of the developing risk profile it should becompared with the financial risk profiles of various strategic options,making it much easier to select appropriate combinations and tohighlight unacceptably high or low total risk combinations. This for anorganisation to decide to finance itself with debt during thedevelopment stage would represent a high total risk combination.
Chapter summary
Test your understanding answers

 Test your understanding 1
The following NFPIs could be used:
- Absenteeism
- Productivity
- Turnover rate (analyse further to identify reasons for leaving)
These give an indication of the morale of employees.


 Test your understanding 2
The experience of existing customers and their perception of thequality of the products or services will help to determine whether thecompany profile is positive or negative. This is particularly importantfor a high profile company, about which everyone will have an opinionwhether or not they have any experience as a customer. This will bebased on the opinions of customers with whom they have contact, and onpress reports which discuss the quality of the company's offering.


 Test your understanding 3
- The impact on and the views of employees. Any decision which affects working practices will have a morale effect on employees. Some decisions, such as to close a department, will have a greater effect than others, for example an increase in production, but both will affect employees.
- The impact on and opinion of customers who will be affected by any decision which changes the finished product or its availability. For example, the deletion of a product will force customers to choose an alternative item.
- Suppliers will be affected by changes to production which require different raw materials or delivery schedules. For example an increase in production may cause the supplier to increase production of the raw material.
- The response of competitors. Any decision to change product specification or pricing will affect competitors who will then choose whether or not to respond.
- The impact on demand for scarce resources. A change in production as a result of the decision may alter the demand for individual resources and the result of the decision may alter availability.
- Any social and environmental effects.


 Test your understanding 4
Financial perspective
- ROCE and RI – overall and by SBU.
- Margins – overall and by product/customer/country.
- Different costs as a percentage of sales – e.g. labour costs/sales, sub-contractor costs/sales.
- Sales growth.
- Cash flow targets.
- Market share.
Customer perspective
- Percentage of scheduled targets met – especially whether contracts are finished on time.
- Percentage of repeated business.
- Number of complaints received.
- Targets for new customers won.
- Percentage of apartments sold off-plan.
Internal business perspective
- Percentage of tenders won.
- Percentage of utilisation of fixed assets – vehicles, plant and machinery.
- Percentage of contracts with cost overruns.
- Cost overrun as percentage of budgeted cost.
- Targets for employee productivity.
- For staffing, environmental and health and safety measures.
Innovation and learning perspective
- Number of patents established for new methods/technologies.
- Percentage of new materials used compared with total materials.
- Percentage of total revenue coming from new buildings using new structural innovations in their design.


 Test your understanding 5
The disadvantages are as follows:
- It is difficult to record and process data of a non-financial, i.e. qualitative, nature.
- Information overload due to the large number of measures that may be chosen. However, Kaplan and Norton recommended that only a handful of measures are used.
- Potential conflict between measures, e.g. profitability may increase in the short-term through a reduction in product development.
- The measures chosen may not align with the strategy and/or vision of the organisation.
- Poor communication to employees/managers - organisations which adopt the balanced scorecard but continue to reward managers on the basis of a narrow range of traditional financial measures are likely to be disappointed with the results.


 Test your understanding 6
Financial Analysis
The significant slowdown in sales growth is predicted to decline in2016 is a major cause for concern. It would be useful to compare theperformance of JMP with its competitors and the market place as a whole.
Export sales continue to form less than 10% of total sales and thisis worrying as the company is operating in a global industry. In 2016JMP predicts a more significant decline in export sales this must beaddressed.
Between 2013 and 2015 there is an upward drift in cost of sales,which may be due to supplier issues or production scheduling problems.The inevitable result of falling sales and increased costs of sales isfalling gross margin.
Expenses do not seem to have been controlled, increasing at afaster rate than turnover. The impact of this on net profit is all tooobvious. Failure to control expenses in a period of reduced growthsuggests poor management control systems and inadequate managementresponse. This is forecast to continue in 2016.
Commitment to research and development in a high tech business iscrucial to continued product innovation. JMP has maintained an R & D: Total sales ratio of 10% or more a year.
However, R & D is difficult to predict in terms of its success and timing of breakthroughs.
The commitment of JMP is good but if this is from increasedborrowing, then banks and other financial intermediaries will be gettingworried about JMP's ability to repay.
Gearing has increased from 42% in 2013 to 160% in 2015 and forecast to be 190% in 2016.
There has been little spending on marketing, which is not untypicalin a high tech business; perhaps the company is under the impressionthat the products sell themselves.
JMP has had some success when marketing spend was relatively low.
Perhaps one of the most worrying performance features is theslowing down in new business generated. In 2013 unfulfilled ordersvirtually matched total sales but the forecast for 2016 sees that thekey ratio falls to barely one-third of total sales. This clearly needsto be addressed.
Balance Scorecard
The balanced scorecard could be used to good effect.
Financially, the current position does not look good. The growth inturnover is slowing down, profitability is falling and the debt ratiois high.
Customer measures are mixed – the company's products are wellregarded but there is an increase in the waiting time for customers.JMP's market share is small and measuring the market share in VOIP isvery difficult because of the bespoke nature of the product.
There is a mixture of signals in terms of progress being made withinternal processes. Products are innovative, but operational andmanagement control procedures appear weak.
Finally, from the perspective of learning / innovation, JMP hasrecognised the need for good people to grow the business, but seems tobe unable to recruit and retain the right calibre of people. Evidencesuggests that a few key personnel have left the company.


 Test your understanding 7
Possible measures (KPIs)
Customer satisfaction
- Repeat purchases.
- Numbers of complaints.
- Value of refunds.
- Sales growth by market segment.
Flexibility
- Product/service introduction time.
- Product/service mix flexibility.
- Internal setup times – the time taken to switch production from one product to another.
- Delivery response time – the time taken to meet customer delivery requests.
Productivity
- Revenue per employee.
- Sales and administration costs as a percentage of sales revenue.
- Units of output per unit of resource.
- Capital asset utilisation.


 Test your understanding 8
Possible measures include:
Financial performance
- Fee levels.
- Material sales.
- Costs.
- Net profit.
- Outside lecturer costs.
Competitiveness
- Market share.
- Sales growth.
- Success rate on proposals.
Quality of service
- Repeat business levels.
- Number of customer complaints.
- Help-line use may be related to tuition quality.
Flexibility
- Availability and use of freelance staff.
- Breadth of skills and experience of lecturers.
Resource utilisation
- Use of freelance lecturers.
- Levels of non-chargeable staff time.
Innovation
- Number of new in-company courses.
- Time to develop new courses.
- New course formats.


 Test your understanding 9
The Performance Prism is an approach to performance measurementwhich is designed to take account of the interests of all stakeholders,such as suppliers, employees, legislators, and local communities. Indoing this it takes a broader approach to stakeholder interests thanmany other performance management models which pay limited attention tostakeholders other than customers and shareholders. The PerformancePrism is based on the principle that the performance of an organisationdepends on how effectively it meets the needs and requirements of allits stakeholders takes stakeholder requirements as the start point forthe development of performance measures rather than the strategy of theorganisation. It also recognises the need to work with stakeholders toensure that their needs are met. The framework can be used to identifymeasures at all levels within the organisation.
The Performance Prism has five facets which are differentperspectives on performance which prompt specific questions. The answersto these questions form the starting point for defining performancemeasures.
These facets are as follows:
Stakeholder satisfaction – Who are our key stakeholdersand what do they want and need? PFM is a key stakeholder of the investeecompanies, and invested in, with a clear requirement for long termshareholder value. It also has other wants and needs relating tocommunication, financial, strategic and ethical performance.
Strategies – What strategies do we need to put in place tosatisfy the wants and needs of our key stakeholders, while satisfyingour own requirements too? For example, strategies to deliver long termshareholder value are likely to meet the requirements of an investeecompany as well as PFM's.
Processes – What processes do we need to put in place toenable us to execute our strategies? Depending on the strategy chosen,companies will identify changes which need to be made to the company andits operations to meet the strategic objectives. These should bereflected in the performance indicators for the company.
Capabilities – What capabilities do we need to put inplace to allow us to operate, maintain and enhance our processes? Anexample of this has already been identified by PFM in the performanceevaluation and incentive scheme for managers.
Stakeholder contribution – What contributions do we wantand need from our stakeholders if we are to maintain and develop thesecapabilities? PFM appears to be a company which wants to make asignificant contribution to the companies it invests in and presumablyhas experience which investee businesses can benefit from.


 Test your understanding 10
Reasons include:
- Poor leadership leading to poor business planning, financial planning, marketing and management.
- Failure to focus on a specific market because of poor research.
- Failure to control cash by carrying too much stock, paying suppliers too promptly, and allowing customers too long to pay.
- Failure to control costs ruthlessly.
- Failure to adapt your product to meet customer needs.
- Failure to carry out decent market research.
- Failure to build a team that is compatible and has the skills to finance, produce, sell and market.
- Failure to pay taxes.
- Failure of businesses' need to grow, merely attempting stability or having less ambitious objectives.
- Failure to gain new markets.
- Under-capitalisation.
- Cash flow problems.
- Tougher market conditions.
- Poor management.
- Companies diversifying into new, unknown areas without a clue about the costs.
- Company directors spending too much money on frivolous purposes thus using all available capital.


 Test your understanding 11
Examples of issues to include:
- an analysis of key ratios, such as liquidity, gearing, cash flow and activity ratios, including trends
- changes in the cash flow of the business
- any history of significant losses
- liability position
- ability to pay creditors on time
- human resources, for example level of dependence on key staff, labour difficulties
- skills and abilities of senior management and an assessment of the strengths and weaknesses of the company
- developments in the market, such as the likelihood of new supermarkets being built near stores
- any regulatory changes which are likely to affect the company
- an analysis of the company report to identify any significant changes over the year.


 Test your understanding 12
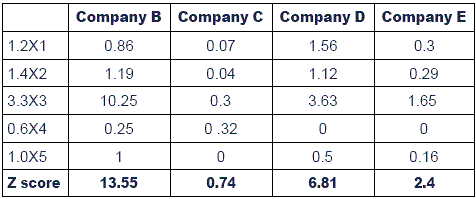
Companies with a Z score of below 1.81 are in danger and possibly heading towards bankruptcy, i.e. company C.
A score between 1.81 and 2.99 means that they need further investigation, i.e. company E.
A score of 3 or above companies are financially sound, i.e. companies B and D.


 Test your understanding 13
The evidence suggests that the company has problems in financial management, production, purchasing and marketing.
Actions required:
- Improve credit control to reduce the debtor days down.
- Address the production process to:
- reduce manufacturing time and stock levels to reduce the requirement for working capital and save costs. This should also improve the ability to respond to customer demands and reduce the need to hold stocks of finished goods
- improve final product quality to reduce returns and improve customer satisfaction.
- Improve marketing activity to address customer satisfaction issues and increase sales.

|
Created at 5/24/2012 4:31 PM by System Account
(GMT) Greenwich Mean Time : Dublin, Edinburgh, Lisbon, London
|
Last modified at 5/25/2012 12:55 PM by System Account
(GMT) Greenwich Mean Time : Dublin, Edinburgh, Lisbon, London
|
|
|
|
 |
Rating
:
|
 Ratings & Comments
(Click the stars to rate the page) Ratings & Comments
(Click the stars to rate the page)
|
 |
Tags:
|
|
|
|
|