Chapter 11: Performance measurement and control
Chapter learning objectives
Upon completion of this chapter you will be able to:
- describe, calculate from given data, and interpret financial performance indicators (FPIs) for profitability, in both manufacturing and service businesses, and suggest methods for improving these measures
- describe, calculate from given data, and interpret FPIs for liquidity in both manufacturing and service businesses, and suggest methods for improving these measures
- describe, calculate from given data, and interpret FPIs for risk in both manufacturing and service businesses, and suggest methods for improving these measures
- describe, calculate from given data and interpret non-financial performance indicators (NFPIs) in both manufacturing and service businesses, and suggest methods for improving the performance indicated
- explain, using non-numerical examples, the causes of, and problems created by, short-termism and financial manipulation of results, and suggest methods to encourage a long-term view
- describe the main behavioural aspects of performance management
- explain the need to allow for external considerations in performance management, in general, with particular reference to:
- stakeholders
- market conditions
- allowance for competitors
- describe ways in which external considerations could be allowed for in performance management, in general, and interpret performance in the light of external considerations
- using simple non-numerical examples, explain and interpret the balanced scorecard and its elements
- using simple non-numerical examples, explain and interpret the building block model proposed by Fitzgerald and Moon
- describe, using simple non-numerical examples, the difficulties of target setting in qualitative areas.
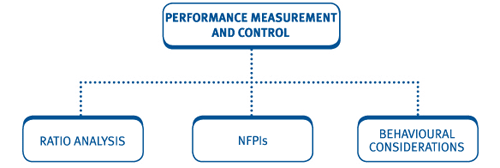
1 Introduction
The calculation of a particular indicator of performance willprobably mean very little, unless it is set in some context.Establishing the value of a particular indicator will add little benefituntil it is:
(1) compared with a budget;
(2) set in a trend;
(3) and/or set against a best practice benchmark.
2 Financial performance and ratio analysis
Examiner's article: visit the ACCA website, www.accaglobal.com, to review the examiner's article written on this topic (April 2008).
A key aspect of performance measurement is ratio analysis. Specificratios are discussed below but some general considerations need to betaken into account with all ratio analysis:
- Many ratios use figures at a particular point in time and thus may not be representative of the position throughout a period. For example, seasonal trade or large one-off items may make year-end figures uncharacteristic.
- Ratios are of little use in isolation. Comparisons could be made to:
- last year's figures to identify trends
- competitors' results and/or industry averages to assess performance.
- Ratios can be manipulated by management. A well known example of ‘window dressing' is to issue spurious invoices before the year end and then issue credit notes just after.
- As with variances, ratios indicate areas for further investigation, rather than giving a definitive answer for management.
- Three main classes of ratios will be reviewed:
- Profitability
- Liquidity
- Risk
 Measuring profitability
The primary objective of a company is to maximise profitability.Profitability ratios can be used to monitor the achievement of thisobjective.
Gross profit margin
This is the gross profit as a percentage of turnover.
A high gross profit margin is desirable. It indicates that eithersales prices are high or that production costs are being kept well undercontrol.
Net profit margin
This is the net profit (turnover less all expenses) as a percentage of turnover.
A high net profit margin is desirable. It indicates that eithersales prices are high or that all costs are being kept well undercontrol.
Return of capital employed (ROCE)
This is a key measure of profitability. It is the net profit as apercentage of the capital employed. The ROCE shows the net profit thatis generated from each $1 of assets employed.
Where capital employed = total assets less current liabilities or total equity plus long term debt.
ROCE is sometimes calculated using operating profit (profit beforefinance charges and tax) instead of net profit. If net profit is notgiven in the question, use operating profit instead.
A high ROCE is desirable. An increase in ROCE could be achieved by:
- Increasing net profit, e.g. through an increase in sales price or through better control of costs.
- Reducing capital employed, e.g. through the repayment of long term debt.
The ROCE can be understood further by calculating the net profit margin and the asset turnover:
ROCE = net profit margin × asset turnover
Asset turnover
This is the turnover divided by the capital employed. The assetturnover shows the turnover that is generated from each $1 of assetsemployed.
A high asset turnover is desirable. An increase in the asset turnover could be achieved by:
- Increasing turnover, e.g. through the launch of new products or a successful advertising campaign.
- Reducing capital employed, e.g. through the repayment of long term debt.

 Test your understanding 1 - Profitability ratios
The following figures are extracted from the accounts of Super Soups, a company selling gourmet homemade soups.

Required: Using appropriate ratios, comment on the profitability of Super Soups.


 Additional example on profitability ratios
Companies X and Y are both involved in retailing. Relevant information for the year ended 30 September 20X5 was as follows:

Required:
Prepare the following ratios for both companies and comment on the results:
(a) ROCE
(b) profit margin
(c) asset turnover.
Solution
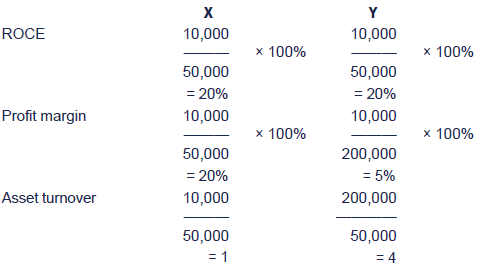
The ROCE for both companies is the same. X has a higher profitmargin, whilst Y shows a more efficient use of assets. This indicatesthat there may be a trade-off between profit margin and asset turnover.

Measuring liquidity
A company can be profitable but at the same time encounter cashflow problems. Liquidity and working capital ratios give some indicationof the company's liquidity.
Current ratio
This is the current assets divided by the current liabilities.
The ratio measures the company's ability to meet its short term liabilities as they fall due.
A ratio in excess of 1 is desirable but the expected ratio varies between the type of industry.
A decrease in the ratio year on year or a figure that is below theindustry average could indicate that the company has liquidity problems.The company should take steps to improve liquidity, e.g. by payingcreditors as they fall due or by better management of receivables inorder to reduce the level of bad debts.
Quick ratio (acid test)
This is a similar to the current ratio but inventory is removedfrom the current assets due to its poor liquidity in the short term.
The comments are the same as for the current ratio.
Inventory holding period
This indicates the average number of days that inventory items are held for.
An increase in the inventory holding period could indicate that thecompany is having problems selling its products and could also indicatethat there is an increased level of obsolete stock. The company shouldtake steps to increase stock turnover, e.g. by removing any slow movingor unpopular items of stock and by getting rid of any obsolete stock.
A decrease in the inventory holding period could be desirable asthe company's ability to turn over inventory has improved and thecompany does not have excess cash tied up in inventory. However, anyreductions should be reviewed further as the company may be strugglingto manage its liquidity and may not have the cash available to hold theoptimum level of inventory.
Receivables (debtor) collection period
This is the average period it takes for a company's debtors to pay what they owe.
An increase in the receivables collection period could indicatethat the company is struggling to manage its debts. Possible steps toreduce the ratio include:
- Credit checks on customers to ensure that they will pay on time
- Improved credit control, e.g. invoicing on time, chasing up bad debts.
A decrease in the receivables collection period may indicate thatthe company's has improved its management of receivables. However, areceivables collection period well below the industry average may makethe company uncompetitive and profitability could be impacted as aresult.
Payables (creditor) period
This is the average period it takes for a company to pay for its purchases.
An increase in the company's payables period could indicate thatthe company is struggling to pay its debts as they fall due. However, itcould simply indicate that the company is taking better advantage ofany credit period offered to them.
A decrease in the company's payables period could indicate that thecompany's ability to pay for its purchases on time is improving.However, the company should not pay for its purchases too early sincesupplier credit is a useful source of finance.

 Test your understanding 2 - Liquidity ratios
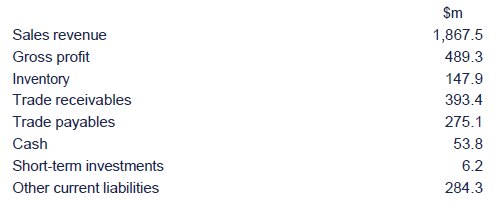
Calculate the liquidity and working capital ratios for P for the year ended 31 December 20X9.

Measuring risk
In addition to managing profitability and liquidity it is alsoimportant for a company to manage its risk. The following ratios may becalculated:
Financial gearing
This is the long term debt as a percentage of equity.
A high level of gearing indicates that the company relies heavilyon debt to finance its long term needs. This increases the level of riskfor the business since interest and capital repayments must be made ondebt, where as there is no obligation to make payments to equity.
The ratio could be improved by reducing the level of long term debt and raising long term finance using equity.
Interest cover
This is the operating profit (profit before finance charges and tax) divided by the finance cost.
A decrease in the interest cover indicates that the company isfacing an increased risk of not being able to meet its finance paymentsas they fall due.
The ratio could be improved by taking steps to increase theoperating profit, e.g. through better management of costs, or byreducing finance costs through reducing the level of debt.
Dividend cover
This is the net profit divided by the dividend.

A decrease in the dividend cover indicates that the company isfacing an increased risk of not being able to make its dividend paymentsto shareholders.

 Ratio analysis
You are employed in the small business section of a medium-sizedbank. Some time ago the bank provided a local manufacturing company, F,with an overdraft facility of $3,000,000. This limit was reached on 30September 20X4 but was increased then to $5,000,000.
Your section head has just received the half-yearly financialstatements of F for the period to 30 September 20X5. Having read thesestatements, your section head is extremely concerned as to theperformance of the company over the last year and is consideringrecommending the termination of the overdraft facility. Before makingany further decision, your section head wishes to have a second opinion.Accordingly, he leaves a file of information concerning F on your deskand requires a report recommending the best course of action.
Information contained in the file:
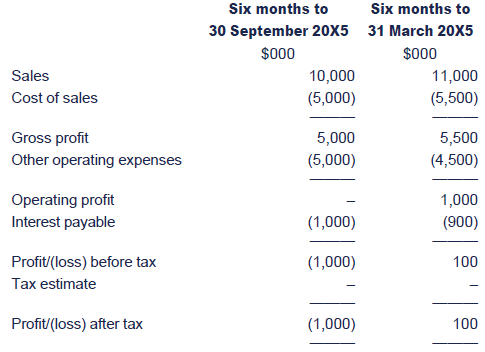
Item 1: Income statements:
Item 2: Balance sheets at 30 September


Item 3: Estimated realisable values of the assets of F at 30 September 20X5, based on a ‘forced sale' scenario:
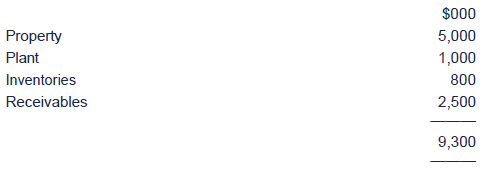
(a) Using the items contained in the file,write a report to your section head which contains an appraisal of theperformance and financial position of F and considers the implicationsfor the bank of calling in the overdraft.
(b) Produce a short appendix to the report youhave compiled in (a). This should summarise the limitations of theinformation available to you as a basis for making a recommendation asto the wisdom or otherwise of calling in the overdraft.
Solution
(a)
REPORT
To: Section head
From: Bank accountant
Subject: F
Date: 22 November 20X5
| (a) | The performance of F appears to have deteriorated in the six months to 30 September 20X5. Sales and cost of sales have both fallen by 9%, so that the gross profit percentage of 50% has been maintained. However, operating expenses have increased, so that total operating costs equal operating income. There is no longer any cover for interest payments. The interest charge has also increased, following the increase in the overdraft facility. |
Despite this deterioration in performance, non-current assets andcurrent assets have increased. The additional $2 million provided bythe bank (an increase in overdraft of 66%) appears to have been used tofinance the purchase of plant at a cost of approximately $500,000 (thefigure represents the change shown by the balance sheet and is net ofdepreciation). The additional depreciation has probably contributed tothe increase in operating expenses.
The retained loss for the year is $900,000 but the actual cashoutflow from operating activities is much greater than this. A roughcalculation is given below:
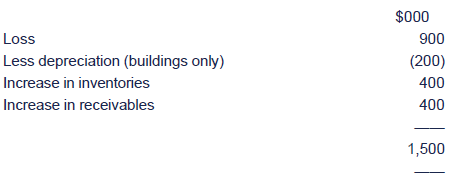
The company's financial position has deteriorated during theyear. At 30 September 20X5 it had a current ratio of 1.06 :1 and a quickratio of 0.67:1 (compared with 1.3:1 and 0.83:1 at 30 September 20X4).The company is likely to experience severe liquidity problems in thenear future.
The company's gearing also gives cause for concern. The companyis very dependent upon finance from outside the business. The mostrecent balance sheet shows a debt to equity ratio of (5,000+4,800)/4,180= 2.34. Interest on the loan notes amounts to $576,000 annually. Atcurrent activity levels, this means that there is very little profitavailable for distribution or investment and very little interest cover.The loan notes are barely covered by the property on which they aresecured.
The combination of adverse cash flow, increase in non-currentassets and working capital and fall in profits seems to suggest badmanagement. However, it is impossible to reach a firm conclusion withoutfurther information.
The withdrawal of the overdraft facility would result in theliquidation of the company. It is estimated that the assets wouldrealise $9,300,000. The loan note holders would be repaid their$4,800,000 in full, leaving a balance of $4,500,000 for the othercreditors. This does not cover the $7,600,000 owed to the bank and theother creditors. Assuming that all unsecured creditors would rankequally, the bank would receive 59c in the dollar or $2,950,000. Thebank would make a loss of $2,050,000.
These calculations show that the bank is facing considerablerisk. If the overdraft facility is to be continued, the bank shouldconsider renegotiating the terms in order to take account of this risk.
(b) Appendix
Only limited information is available as a basis for making this decision.
One major shortcoming of conventional financial statements isthat they are based on historical information. They give a goodindication of the financial position at 30 September 20X5, but some timehas already elapsed since that date. During that time the positioncould have changed dramatically. For example, the company could have wonsubstantial new business, or receivables could have been realised, orinventory could have been sold. Financial statements are only of limiteduse in predicting the future of a company.
To make an informed decision, the bank would need informationabout several other factors which are not reflected in the financialstatements. The velocity of circulation of working capital, the qualityof the company's management and its ability to attract new business willall be crucial in determining whether or not F survives. For example,the decision to invest in additional plant and to increase inventorylevels might have been taken as a result of several new orders. The bankwould also need to assess the willingness of the loan note holders andother creditors to continue to support the company. For example, thereis no information as to how soon the loan notes will become repayable oras to the means by which the company intends to repay the loan.

3 Issues surrounding the use of financial performance indicators to monitor performance
All of the ratios reviewed so far have concentrated on thefinancial performance of the business. Many of these ratios, e.g. ROCE,gross profit margin, may be used to assess the performance of a divisionand of the manager's in charge of that division.
Achievement of these target ratios (financial performanceindicators) may be linked to a reward system in order to motivatemanagers to improve performance.
However, there are a number of problems associated with the use of financial performance indicators to monitor performance:
Short-termism
Linking rewards to financial performance may tempt managers to makedecisions that will improve short-term financial performance but mayhave a negative impact on long-term profitability. E.g. they may decideto cut investment or to purchase cheaper but poorer quality materials.
Manipulation of results
In order to achieve the target financial performance and hencetheir reward, managers may be tempted to manipulate results. Forexample:
Accelerating revenue - revenue included in one year may be wronglyincluded in the previous year in order to improve the financialperformance for the earlier year.
Delaying costs - costs incurred in one year may be wrongly recordedin the next year's accounts in order to improve performance and meettargets for the earlier year.
Understating a provision or accrual - this would improve the financial performance and may result in the targets being achieved.
Manipulation of accounting policies - for example, closinginventory values may be overstated resulting in an increase in profitsfor the year.
Do not convey the full picture
The use of these short-term financial performance indicators haslimited benefit to the company as it does not convey the full pictureregarding the factors that will drive long-term profitability, e.g.customer satisfaction, quality.
Therefore, when monitoring performance, a broader range of measures should be used. This will be reviewed in the next section.

 Illustration 1 – Problems of financial performance indicators
A company may measure the performance of managers on the basis of atarget ROCE. This may lead to the following undesirable behaviour:
- Managers may focus on generating short-term profit at the expense of long-term profit. For example, managers may reduce expenditure on training, research and development and maintenance.
- The ROCE will improve if the capital employed figure falls. Managers may therefore be reluctant to invest in new assets.
- Year-end results may be manipulated to improve ROCE. For example, managers may delay payments to creditors or stock purchases.
- Managers may focus their attention on financial performance and neglect non financial performance such as quality and customer service. This may improve profit in the short-term but lead to a long-term decline in profitability.


 Test your understanding 3
Suggest methods of overcoming the problems of short-termism and manipulation of results and encouraging a long-term view.

4 Non-financial performance indicators (NFPIs)
Introduction
- The previous section reviewed the problems of using financial performance indicators as the sole indicator of performance.
- This section will review the use of non-financial performance indicators as an additional tool to monitor performance and maximise long-term profitability.
- As we will see, a company may choose to use a mixture of financial and non-financial performance indicators in order to achieve the optimum system for performance measurement and control.
- A firm's success usually involves focussing on a small number of critical areas that they must excel at. These factors vary from business to business but could include:
- Having a wide range of products that people want.
- Having a strong brand name or image.
- Low prices.
- Quick delivery.
- Customer satisfaction, perhaps through high quality.
- Most of these are best assessed using non-financial performance indicators. Financial performance appraisal often reveals the ultimate effect of operational factors and decisions but non-financial indicators are needed to monitor causes.

 Illustration 2 – Non-financial performance measurement
BAA (the former state-owned British Airports Authority) usesregular customer surveys for measuring customer perceptions of a widevariety of service quality attributes, including:
- the cleanliness of its facilities
- the helpfulness of its staff
- the ease of finding one's way around the airport.
Public correspondence is also analysed in detail, and comment cardsare available in the terminals so that passengers can commentvoluntarily on service levels received.
Duty terminal managers also sample the services and goods offeredby outlets in the terminals, assessing them from a customer perspective.They check the cleanliness and condition of service facilities andcomplete detailed checklists, which are submitted daily to seniorterminal managers.
The company has also a wealth of internal monitoring systems thatrecord equipment faults and failures, and report equipment and staffavailability.
These systems are supported by the terminal managers who circulatethe terminals on a full-time basis, helping customers as necessary,reporting any equipment faults observed and making routine assessmentsof the level of service provided by BAA and its concessionaires.


 Test your understanding 4
Better Nutrition Ltd provides advice to clients in medical, dietaryand fitness matters by offering consultation with specialist staff. Thebudget information for the year ended 31 May 2010 is as follows :

Note: Client consultations includes those carried out byoutside specialists. There are now 4 full-time consultants carrying outthe remainder of client consultations.
Other information:
(i)Clients are charged a fee per consultation at the rate of: medical $75; dietary $50 and fitness $50.
(ii) Health foods are recommended andprovided only to dietary clients at an average cost to the company of$10 per consultation. Clients are charged for such health foods at costplus 100% mark-up.
(iii)Each customer enquiry incurs a variable cost of $3, whether or not it is converted into a consultation.
(iv)Consultants are each paid a fixed annual salary as follows: medical $40,000; dietary $28,000; fitness $25,000.
(v) Sundry other fixed cost: $300,000.
Actual results for the year to 31 May 2010 incorporate the following additional information:
(i)A reduction of 10% in health foodcosts to the company per consultation was achieved through arationalisation of the range of foods made available.
(ii) Medical salary costs were alteredthrough dispensing with the services of two full-time consultants andsub-contracting outside specialists as required. A total of 1,900consultations were sub-contracted to outside specialists who were paid$50 per consultation.
(iii)Fitness costs were increased by $80,000 through the hire of equipment to allow sophisticated cardio-vascular testing of clients.
(iv)New computer software has beeninstalled to provide detailed records and scheduling of all clientenquiries and consultations. This software has an annual operating cost(including depreciation) of $50,000.
Required:
(a) Prepare a statement showing the financial results for the year to 31 May 2010 in tabular format. This should show:
(i)the budget and actual gross margin for each type of consultation and for the company
(ii) the actual net profit for the company
(iii)the budget and actual margin ($) per consultation for each type of consultation
(Expenditure for each expense heading should be shown in (i) and (ii) as relevant.)
(b) Suggest ways in which each of the followingperformance measures could be used to supplement the financial resultscalculated in (a). You should include relevant quantitative analysis foreach performance measure:
(1) Competitiveness
(2) Flexibility
(3) Resource utilisation
(4) Quality
(5) Innovation

The balanced scorecard
The balanced scorecard approach to performance measurement andcontrol emphasises the need to provide management with a set ofinformation which covers all relevant areas of performance.
It focuses on four different perspectives and uses financial and non-financial indicators.
The four perspectives are:
Customer – what is it about us that new and existing customers value?
Internal – what processes must we excel at to achieve our financial and customer objectives?
Innovation and learning – how can we continue to improve and create future value?
Financial – how do we create value for our shareholders?
Within each of these perspectives a company should seek to identify a series of goals and measures.

 Test your understanding 5
Faster Pasta is an Italian fast food restaurant that specialises inhigh quality, moderately priced authentic Italian pasta dishes andpizzas. The restaurant has recently decided to implement a balancedscorecard approach and has established the following relevant goals foreach perspective:

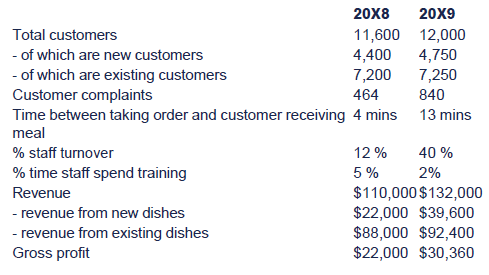
The following information is also available for the year just ended and for the previous year.
Required:
Using appropriate measures, calculate and comment on whether or not Faster Pasta has achieved its goals.


 Additional example on the balanced scorecard
One example reported in management literature of how the balancedscorecard might be applied is the US case of Analog Devices (a semiconductor manufacturer) in the preparation of its five-year strategicplan for 1988-1992.
Analog Devices had as its main corporate objective:
‘Achieving our goals for growth, profits, market share andquality creates the environment and economic means to satisfy the needsof our employees, stockholders, customers and others associated with thefirm. Our success depends on people who understand the interdependenceand congruence of their personal goals with those of the company and whoare thus motivated to contribute towards the achievement of thosegoals.'
Three basic strategic objectives identified by the company were market leadership, sales growth and profitability.
The company adopted targets as follows:
Customer perspective
- Percentage of orders delivered on time. A target was set for the five-year period to increase the percentage of on-time deliveries from 85% to at least 99.8%.
- Outgoing defect levels. The target was to reduce the number of defects in product items delivered to customers from 500, to fewer than 10, per month.
- Order lead time. A target was set to reduce the time between receiving a customer order to delivery from 10, to less than 3, weeks.
Internal perspective
- Manufacturing cycle time. To reduce this from 15 weeks to 4-5 weeks over the five-year planning period.
- Defective items in production. To reduce defects in production from 5,000, to fewer than 10, per month.
Learning and innovation perspective
- Having products rated ‘number one' by at least 50% of customers, based on their attitudes to whether the company was making the right products, performance, price, reliability, quality, delivery, lead time, customer support, responsiveness, willingness to co-operate and willingness to form partnerships.
- The number of new products introduced to the market.
- Sales revenue from new products.
- The new product sales ratio. This was the percentage of total sales achieved by products introduced to the market within the previous six quarters.
- Average annual revenues for new products in their third year.
- Reducing the average time to bring new product ideas to the market.
Financial targets were set for revenue, revenue growth, profit andreturn on assets. But the idea was that the financial targets would flowfrom achieving the other targets stated above.
Analog Devices sought to adopt financial and non-financialperformance measures within a single system, in which the varioustargets were consistent with each other and were in no way incompatible.

Benefits of the balanced scorecard:
- It focuses on factors, including non-financial ones, which will enable a company to succeed in the long-term.
- It provides external as well as internal information.
Problems with the balanced scorecard:
- The selection of measures can be difficult. For example, how should the company measure innovation?
- Obtaining information can be difficult. For example, obtaining feedback from customers can prove difficult.
- Information overload due to the large number of measures that may be chosen.
- Conflict between measures. For example, profitability may increase in the short-term through a reduction in expenditure on staff training.
The building block model
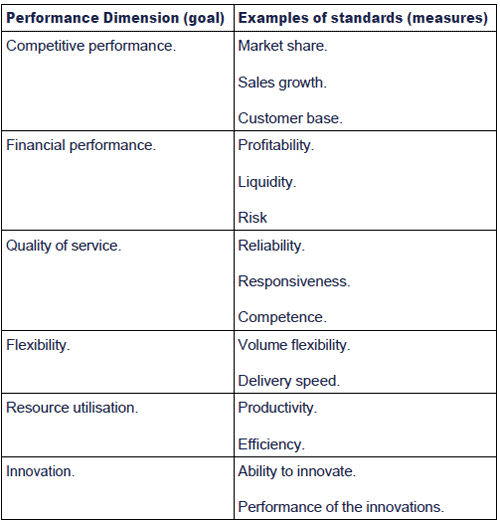
Fitzgerald and Moon adopted a framework for the design andanalysis of performance management systems. They based their analysis onthree building blocks:
Dimensions
Dimensions are the goals for the business and suitable measuresmust be developed to measure each performance dimension. There are sixdimensions in the building block model.
Standards
These are the measures used. To ensure success it is vital that employees view standards as achievable, fair and take ownership of them.
Rewards
To ensure that employees are motivated to meet standards, targets need to be clear and linked to controllable factors.

 Test your understanding 6 - Standards and rewards
Explain why it is important to:
(i)consider ownership, achievability and equity when setting standards.
(ii) consider clarity, motivation and controllability when setting rewards.


 Additional example on the building block model
Required:
Using the six dimensions of Fitzgerald and Moon suggest some measures (standards) for a national car dealership network.
Solution


5 External considerations
Performance measures provide useful information to management which aid in the control of the business.
However, they need to be considered in the context of theenvironment external to the business to gain a full understanding of howthe business has performed and to develop actions which should be takento improve performance. External considerations which are particularlyimportant are:
- Stakeholders - a stakeholder is any individual or group that has an interest in the business and may include:
- shareholders
- employees
- loan providers
- government
- community
- customers
- environmental groups
Stakeholders will have different objectives and companies maydeal with this by having a range of performance measures to assess theachievement of these objectives.
- Market conditions - these will impact business performance. For example, a downturn in the industry or in the economy as a whole could have a negative impact on performance.
- Competitors - the actions of competitors must also be considered. For example, company demand may decrease if a competitor reduces its prices or launches a successful advertising campaign.

 Test your understanding 7 - Stakeholder considerations
NW is an electricity and gas provider for residential and business properties.
The business was nationalised in the past (State owned) but has more recently become a privatised company.
Annual data from NW's accounts are provided below relating to its first three years of operation as a private sector concern.
Also shown, for comparison, is the proforma data as included in theprivatisation documents. The proforma accounts are notional accountsprepared to show the performance of the company in its last year underpublic ownership as if it had applied private sector accountingconventions. They also incorporate a dividend payment based on thedividend policy declared in the prospectus.
The activities of privatised utilities are scrutinised by aregulatory body, which restricts the extent to which prices can beincreased.
The demand for gas and electricity in the area served by NW hasrisen over time at a steady 2% pa , largely reflecting demographictrends.
Key financial and operating data for year ending 31 December ($m)

Required:
Using the data provided, assess the extent to which NW has met theinterests of the following groups of stakeholders in its first threeyears as a privatised enterprise. If relevant, suggest what other datawould be helpful in forming a more balanced view.
(i)Shareholders
(ii) Consumers
(iii)Workforce
(iv)Government, through NW's contribution to the achievement of the government's objectives of price stability and economic growth.

6 Chapter summary
Test your understanding answers

 Test your understanding 1 - Profitability ratios
Profitability ratios

Comment
Overall, profitability has deteriorated slightly year on year.
Gross profit margin - Despite an increase in turnover of 24.6%, thegross profit margin has fallen by over 2% to 31.5%. Although turnoverhas shown a significant increase, the production costs have increased ata faster rate of 28.7% year on year. The falling gross profit marginmay indicate that the company is unable to achieve the same level ofsales prices as it was in 20X8 or is not as efficient at controlling itsproduction costs.
Net profit margin - Again, despite an increase in turnover of24.6%, the net profit margin has fallen from 7.49% to 6.18%. The fallingnet profit margin may indicate that the company is unable to achievethe same level of sales prices as it was in 20X8 or is not as efficientat controlling all of its costs.
Asset turnover - this has actually shown a small improvement yearon year from 1.34 in 20X8 to 1.59 in 20X9. This shows that the companyis getting better at generating turnover from the capital employedwithin the business.
ROCE - Despite the improvement in asset turnover, the ROCE hasactually fallen slightly from 10.03% in 20X8 to 9.83% in 20X9. Thismeans that the company is not as good at generating net profit from itscapital employed. The decrease in the ROCE is due to the fall in the netprofit margin.
It would be useful to obtain a further breakdown of turnover andcosts, in order to fully understand the reasons for the changes and toprevent any further decline in the ratios discussed. It would also beuseful to obtain the average ratios for the industry in order to gaugeSuper Soups performance against that of its competitors.


 Test your understanding 2 - Liquidity ratios


 Test your understanding 3
- Rewards may be linked to a wider variety of performance measures including some non-financial measures.
- Capital investment decisions may be reviewed centrally and judged on the basis of net present value (NPV).
- Managers may be rewarded according to the overall performance of the company rather than their own responsibility centre. This may help goal congruence but may not be motivating if poorly- performing managers are rewarded in the same way as managers who are performing well.


 Test your understanding 4
(a) Operating statement for the year ended 31 May 2010

(b)Competitiveness may be measured in terms ofthe relative success/failure in obtaining business from enquiries fromcustomers. The percentages are as follows.

Repeat business suggests customer loyalty. The new businessfigures are disappointing, being below the budgeted level of uptake. Inabsolute terms, however, new business is 5,000 consultations abovebudget whereas repeat business is 2,000 consultations below budget.
There are variations within the types of consultation. Medicaland dietary are down on budget by approximately 8% and 16% respectively.Fitness is up on budget by approximately 60%.
Flexibility may relate to the company being able to cope withflexibility of volume, delivery speed and job specification. Examples ofeach may be taken from the information in the management accounts.Additional fitness staff have been employed to cope with the extravolume of clients in this area of business.
Medical staff levels have been reorganised to include the use ofexternal specialists. This provides flexibility where the type of advicerequired (the job specification) is wider than expected and may improvedelivery speed in arranging a consultation more quickly for a client.
Dietary staff numbers are unchanged even though the number ofconsultations has fallen by 16% from budget. This may indicate a lack offlexibility. It may be argued that the fall in consultations wouldwarrant a reduction in consultant numbers from 12 to 11. This couldcause future flexibility problems, however, if there was an upturn inthis aspect of the business.
Resource utilisation measures the ratio of output achieved frominput resources. In this case the average consultations per consultantmay be used as a guide:

These figures show that:
(1) Medical consultants are beingunder-utilised. Could this be due to a lack of administrative control?Are too many cases being referred to the outside specialists? This may,however, be viewed as a consequence of flexibility - in the use ofspecialists as required.
(2) Dietary consultants are beingunder-utilised. Perhaps there should be a reduction in the number ofconsultants from 12 to 11 as suggested above.
(3) Fitness consultants are carrying outconsiderably more consultations (+20.8%) than budgeted. There arepotential problems if their quality is decreasing. Overall complaintsfrom clients are up by 120%. How many relate to fitness clients?
It may be, however, that the new cardio-vascular testingequipment is helping both throughput rates and the overall level ofbusiness from fitness clients.
Quality of service is the totality of features andcharacteristics of the service package that bear upon its ability tosatisfy client needs. Flexibility and innovation in service provisionmay be key quality factors.
The high level of complaints from clients (up from 1% to 2% ofall clients) indicates quality problems which should be investigated.
Quality of service may be improving. For example the newcardio-vascular testing equipment may be attracting extra clientsbecause of the quality of information which it provides. Quality mayalso be aided through better management of client appointments andrecords following the introduction of the new software systems.
Innovation may be viewed in terms of the performance of aspecific innovation. For example, whether the new computer softwareimproved the quality of appointment scheduling and hence resourceutilisation; improved competitiveness in following up enquiries andhence financial performance; improved flexibility in allowing betterforward planning of consultant/client matching.
Innovation may also be viewed in terms of the effectiveness ofthe process itself. Are staff adequately trained in its use? Does thenew software provide the data analysis which is required?


 Test your understanding 5
Customer perspective
Goal: To increase the number of new and returning customers
Measure: The number of new customers has increased year onyear from 4,400 to 4,750. This is an 8.0% increase. The number ofreturning customers has also increased slightly from 7,200 to 7,250,i.e. a 1.0% increase.
Comment: The company has achieved its goal of increasing thenumber of new and existing customers. It is worth noting that theproportion of customers who are returning customers has fallen slightlyfrom 62.1% to 60.4% of the total customers. This could indicate a smalldrop in the level of customer satisfaction.
Goal: To decrease the % customer complaints
Measure: The percentage of customer complaints has increased from 4% (464 ÷ 11,600) to 7% (840 ÷ 12,000).
Comment: Faster Pasta should investigate the reasons for theincrease in customer complaints and take the required actionimmediately in order to ensure that it can meet this goal in the future.
Internal perspective
Goal: To reduce the time taken between taking the customer's order and delivering the meal to the customer
Measure: The time taken has more than tripled from an average of 4 minutes in 20X8 to an average of 13 minutes in 20X9.
Comment: Customers may place a high value on the fastdelivery of their food. The increase in time may be linked to theincreased number of customer complaints. If this continues customersatisfaction, and therefore profitability, will suffer in the long-term.The restaurant should take steps now in order to ensure that this goalis achieved going forward.
Goal: To reduce staff turnover
Measure: This has risen significantly from 12% to 40% and hence the business has not achieved its goal.
Comment: The reasons for the high staff turnover should beinvestigated immediately. This may be contributing to longer waitingtimes and the increase in customer complaints. This will impactlong-term profitability.
Innovation and learning perspective
Goal: To increase the proportion of revenue from new dishes
Measure: This has increased year on year from 20% ($22,000÷ $110,000) in 20X8 to 30% ($39,600 ÷ $132,000) in 20X9. Therefore,the restaurant has achieved its goal.
Comment: This is a favourable increase and may have apositive impact on long-term profitability if the new products meet theneeds of the customers.
Goal: To increase the % of staff time spent on training.
Measure: This has fallen significantly from 5% to only 2% and hence the company is not achieving its goal.
Comment: Staff may be unsatisfied if they feel that theirtraining needs are not being met. This may contribute to a high staffturnover. In addition, staff may not have the skills to do the job welland this would impact the level of customer satisfaction.
Financial perspective
Goal: to increase spend per customer
Measure: Spend per customer has increased from $9.48 ($110,000 ÷ 11,600) to $11.00 ($132,000 ÷ 12,000), i.e. a 16.0% increase.
Comment: This is a favourable increase. However, the issuesdiscussed above must be addressed in order to ensure that this trendcontinues.
Goal: To increase gross profit margin.
Measure: The gross profit margin has increased year on year from 20% ($22,000 ÷ $110,000) to 23% ($30,360 ÷ $132,000).
Comment: This is a favourable increase. However, the issuesdiscussed above must be addressed in order to ensure that this trendcontinues.


 Test your understanding 6 - Standards and rewards
(i)Managers who participate in thesetting of standards are more likely to accept and be motivated by thestandards than managers on whom standards are imposed. An achievablestandard is a better motivator than an unachievable one – althoughresearch has been undertaken into how much ‘stretch' ought to be builtinto budgets. When setting standards across an organisation, careshould be undertaken to ensure that all managers haveequally-challenging standards. Achieving equity in this last regard maybe difficult when measures used for different managers and businesssectors within an organisation may be very different in character to oneanother.
(ii) Consideration of rewards involvesuse of concepts including ‘clarity', ‘motivation' and‘controllability'. Goal clarity contributes to motivation. Forexample, a standard of ‘achieving 4 product innovations per year'might be a more effective motivator than ‘giving a high profile toproduct innovation'. The actual means of motivation may involveperformance-related salary bonuses, an assessment scheme point score oraccess to promotion channels. Managers will be better motivated if theyactually control the factors contributing to achievement of the measuresand standards on which their rewards are based.


 Test your understanding 7 - Stakeholder considerations
Shareholders
Shareholders will want returns in the form of dividends and shareprice growth. By following policies to promote these requirements NWwill maximise shareholder wealth.
The dividend has risen from a proforma 7c in 20X1 to 20c in 20X4.This represents growth of approximately 186% over the period. PAT hasincreased from 21 in 20X1 to 65 in 20X4, an increase of 210%. Sinceinflation is only 9% for the period, it would suggest that the needs ofthe shareholders have been met.
Consumers
Consumers will be interested in prices. The regulator restricts the extent by which prices can be increased.
We have information about the volume of the market (growing at 2 %pa) and can therefore measure the price rises by removing the volumegrowth from turnover.

We can see that after taking out the growth, prices have risen atapproximately 9.1% pa, which is well above the rate of inflation for theperiod (1.4%).
Whether or not this is justified depends on factors such as wherethe money has been spent. Has it gone into capital expenditure(improving the supplies or preventing leaks) or has it been used toincrease dividends?
Workforce
The workforce has fallen by 2,000 from its 12,000 level in 20X1.Whilst it is possible that NW was overstaffed, shedding over 15% of theworkforce will have affected morale.
Average wages have risen from $8,333 to $8,600 over the period, arise of just over 3% for the period. Had the workforce enjoyed pay risesin line with inflation they could have expected to earn $9,083 in 20X4.This means they are actually worse off in real terms.
Without more information (e.g. skills mix of labour force,full/part-time employees) it is hard to comment, but the increasedprofitability of NW does not appear to have been passed on to them.
At the same time, the directors' emoluments have nearly quadrupled.We could again do with more information such as the number of directorsinvolved. Part of the increase will be to bring fees in line with theprivate sector and part of it could be linked in with the share price.However, their fees as a percentage of the whole wage bill have risenfrom 0.8% to 3.4% over the period.
The figures probably will not include other perks such as share options.
The directors may increasingly find themselves having to justify ‘fat cat' salaries.
Government
Price stability
Prices have risen by 38% in absolute, and 30% in real, terms which will not be in line with price stability.
Wages have been held down to less than the headline RPI, but at the same time directors' emoluments have risen sharply.
Economic growth
This is difficult to measure without more details, but we couldcalculate various ratios such as ROCE or net margin to measure thesituation. Both have shown improvement over the period.

Capital expenditure has risen by 275% over the period. This wouldbe expected to generate a knock-on growth elsewhere in the economy.

|
Created at 5/24/2012 4:43 PM by System Account
(GMT) Greenwich Mean Time : Dublin, Edinburgh, Lisbon, London
|
Last modified at 5/25/2012 12:54 PM by System Account
(GMT) Greenwich Mean Time : Dublin, Edinburgh, Lisbon, London
|
|
|
|
 |
Rating
:
|
 Ratings & Comments
(Click the stars to rate the page) Ratings & Comments
(Click the stars to rate the page)
|
 |
Tags:
|
|
|
|
|