Chapter 14: Financial Analysis
Chapter learning objectives
Upon completion of this chapter you will be able to:
- explain, for both profit-seeking and non-profit-seeking organisations, the relationship between strategy and finance
- determine, from information provided, the overall investment requirements of a business
- identify the advantages and disadvantages of alternative sources of finance listed in a question
- explain, for businesses in general, how their current and non-current assets should be managed with regard to finance and risk
- using information provided in the question, devise and apply appropriate ratios to assess how efficiently an organisation is using its current resources
- using information provided in the question, apply appropriate gearing ratios to assess the risks associated with financing and investment in the organisation
- using information provided in the question, apply appropriate liquidity ratios to assess the organisation's short-term commitments to creditors and employees
- using information provided in the question, apply appropriate profitability ratios to assess the viability of chosen strategies
- using information provided in the question, apply appropriate investment ratios to assist investors and shareholders in evaluating organisational performance and strategy
- explain the role and uses of standard costing and budgets
- calculate and assess the causes of different variances from standard
- evaluate decisions that include risk and uncertainty by using decision trees
- make decisions based on marginal and relevant costs techniques in areas such as accepting special contracts or discontinuing activities.

1 The relationship between strategy and finance
Finance can be a critical factor for identifying and implementing successful strategies. Key issues are as follows:
Managing for value
- Are funds being used to increase shareholder value? This is explored in more detail in the next section.
Financial expectations of stakeholders
- Shareholders want to see their wealth increased in terms of growing dividends and an improving share price.
- This requires a business that can generate sufficient cash to pay dividends and reinvest for the future.
- However, there are financial expectations for other stakeholders as well.

 Financial expectations of stakeholders
It is generally accepted that the strategic objective of aprofit-seeking organisation is the long-term goal of maximising thewealth of the owners (usually shareholders) of the organisation.
- Shareholder view – the only responsibility for business is to make money for shareholders – the market is the best way to allocate scarce resources.
- Stakeholder view – there is a responsibility for organisations to regulate the employment relationship to ensure fairness for a range of stakeholders.
It is no longer enough to be profitable and have positive cash flowto be judged successful. All of the company's stakeholders require thecompany to perform within a narrow band of predetermined expectations.Failure to fall within the band of expected performance can, and will,result in:
- reduced access to funding both debt and equity
- loss of employee morale and de-motivation
- loss of customers and suppliers
- shareholder revolt.
Unless otherwise pre-warned:
- lenders expect profits, positive cash flow, growth and debt reduction
- employees expect increased wages and benefits as well as stable employment and growth
- creditors and suppliers expect payment within invoice terms and growth
- customers expect timely and complete delivery of services and products with increasing value and quality at appropriate pricing
- shareholders expect the continuance of the business enterprise and a fair financial return as payment of risk bearing and the use of their capital.

Funding strategies
- Which SBUs in the company's portfolio should be funded?
- What is the most appropriate way of funding particular investments, balancing business and financial risks?
Funding strategies should be focused on balancing the business and financial risks faced by shareholders.
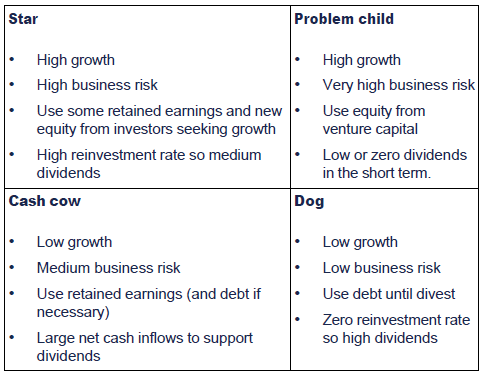
- In simplistic terms, if SBUs have high business risk, then funding should be selected with lower financial risk (i.e. low gearing, so use equity).
- In addition, the expectations/profile of equity investors can be matched with project characteristics (e.g. growth).
A useful model for considering these is the BCG Matrix met as part of strategy analysis earlier in the syllabus.

 Funding strategies in the BCG matrix

2 Managing for value
Managing for value
All organisations benefit from committing themselves to a strategy that describes:
- the value that an organisation intends to produce
- the means it will rely on to produce that value
- how it will sustain itself in the future.
Value creation is achieved using three key elements of strategic management, as shown below:
Managing for Value (MFV) moves the focus of business management away from a largely 'scale-driven' approach.
- How much do we produce of this?
- How many countries do we sell to?
- Are we the biggest?
Towards a 'value-driven' approach.
- What contribution is this brand or this product range making to the overall value of the company?
- What financial return are we obtaining from our ongoing investment in it?
This shift in approach recognises the importance of providingadequate returns to shareholders and of keeping the good opinion ofinstitutional investors.

 Illustration 1 – Managing For Value
Adopting MFV caused Cadbury Schweppes to scrutinise all itsoperations. The company rationalised its activities, sold those beveragebrands that were underperforming and as a consequence withdrew fromparticipating in beverages in more than 150 markets.
By selling its underperforming beverage brands to other firms,Cadbury Schweppes raised almost $1 billion. This led to a new challenge:how to put this inflow of funds to best use within the overall MFVinitiative. It reviewed its business in search of the most promising'areas for action'.
Applying MFV principles Cadbury Schweppes challenged all itsbusinesses to find ways to use funds that would tackle two problemssimultaneously: to revitalise some familiar brands and to produce ahigher return on advertising expenditure.
Cadbury Trebor Bassett in the UK responded with a new Cadburycreation: Cadbury LAND, which took a year to develop. Cadbury LANDcapitalises on children's love of likeable characters placed in a worldof their own. A character is attached to each brand. The character'spersona reflects the brand. Each is rather zany. Thus, Buttons is 'a bitdizzy and giggles a lot', Wildlife is 'an eccentric old buffer' andFudge is 'a bit of a loony'.
In early 1999, Cadbury achieved the biggest share of the market forchildren's chocolate, in terms of total sales value – a position ithas kept. MFV requires a company and all of its employees to understandhow and where value is created and how and where it is destroyed.Cadbury LAND was created within the disciplined framework that an MFVapproach imposes.


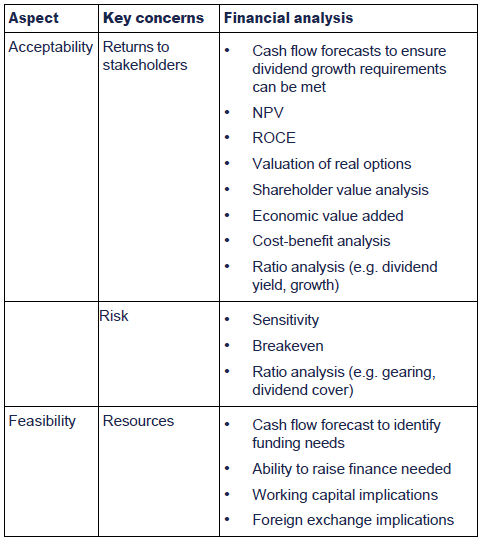
 Strategic choice and financial analysis
The main aspect of strategic planning that is impacted by and impacts finance is strategic choice:

3 Not-for-profit organisations
Objectives of 'not-for-profit' organisations
Organisations such as charities and trade unions are not run tomake profits, but to benefit prescribed groups of people. Since theservices provided are limited primarily by the funds available, theiraim is:
- to raise the maximum possible sum each year (net of fund-raising expenses)
- to spend this sum as effectively as possible on the target group (with the minimum of administration costs).

 Short term targets for NFPs
Not-for-profit organisations will normally set targets forparticular aspects of each accounting period's finances, such as thefollowing.
- Total to be raised in grants and voluntary income.
- Maximum percentage that fund-raising expenses represents of this total.
- Amounts to be spent on specified projects.
- Maximum permitted administration costs.
The actual figures achieved can then be compared with these targets and control action taken if necessary.

Value management in NFPs
An alternative strategy model developed for use with governmentorganisations focuses the attention of managers on three key issues:
- public value to be created
- sources of legitimacy and support for the organisation
- operational capacity to deliver the value.
This focuses attention on social purpose and on the ways in whichsociety as a whole might be mobilised to contribute to social purposesrather than on the financial objectives that can be achieved by sellingproducts and services to markets.
Funding strategies for NFPs
What most non-profit organisations need are their core costs covered.
 Core costs are the expenditure budgets that are not connected with thelevels of activity undertaken by an organisation.
They are:
- the costs that will always need to be funded, regardless of the number of projects and
- are usually fundamental to the organisation's survival, even if they cannot be directly associated with any specific outcome.

 Further examples of core costs
Core costs can be placed under three headings:


An organisation can only look ahead with confidence when the fundamental core costs are securely funded.
Creating a core funding strategy has different forms at each stage of a non-profit-seeking organisation's evolution.
- Infancy – tends to be heavily dependent on one funding source, which can limit independence.
- Growth phase – if funded by a multitude of projects and many donors it is prone to the pitfalls of mission creep (the expansion of a project or mission beyond its original goals, often after initial successes) and inefficiency.
- Maturity and maintenance – funding should be derived from a constantly changing mix of sources.

 Illustration 2 – Not-for-profit organisations
For a non-governmental organisation (NGO), protecting the corefunding is the responsibility of the trustees. This requires more thanensuring that the annual accounts do not show an unrestricted deficit,all NGOs need to have a long-term plan as to how the core funds will bemet for years ahead. A core funding strategy is a forward thinking,evolving document. It is more than a policy.
An NGO's CEO, Fundraising Director/Manager and the FinanceDirector/Manager will need to develop the actual strategy and manage itsimplementation. Each project manager will need to understand how theirproject budget contributes to the overall strategy.
There are five main elements to core funding.
- Strategic funding – is funding from regular, reliable donors who make an open-ended commitment to an organisation, e.g. institutional donors, wealthy individuals and faith-based communities.
- Apportioning overheads into project budgets – sometimes referred to as the business model, as it is a common formula for determining product pricing. Each project budget is expected to make a contribution towards overheads.
- Self-generated income – is where part of the core costs is funded by activities within its own control – where the donors don't specify how the funds are to be applied, e.g. an endowment, trading, fundraising events, legacy income and membership income.
- Developmental funding – donors agree to invest in the transformation of an organisation's infrastructure for a defined period. They can be described as 'second stage pump primers'.
- Cost minimisation – is astute financial management aimed at reducing core costs to an acceptable minimum. Securing gifts in kind and volunteers are excellent ways of minimising costs, as long as these gifts and the volunteers are effective in ensuring that core activities are delivered.


 Test your understanding 1
What are the differences in strategic and operational decisionsthat a financial manager in a state-owned enterprise makes compared toone in the private sector listed company on the Stock Exchange?

4 Financing decisions
Funding requirements
Cash forecasting is vital to ensure that sufficient funds will beavailable when they are needed to sustain the activities of anenterprise, at an acceptable cost. Forecasts provide an early warning ofliquidity problems by estimating:
- how much cash is required
- when it is required
- how long it will be required for
- whether it will be available from anticipated sources.
Any forecast deficiency will have to be funded.
Alternative sources of finance
Financing was covered in detail in paper F9. A brief summary of alternatives and considerations are given here.
Factors to consider when choosing a financing package
- Cost
- Gearing
- Control
- Security
- Cash flow
- Availability
- Exit routes

 Factors to consider when choosing a financing package
Factors to consider when choosing a financing package
(1)Cost
- A bank loan is cheaper than an overdraft. Why? Because it is less risky from the bank's perspective. They have a repayment schedule, the loan may be secured, etc.
- Risk to the investor is the main determinant of the cost of the finance.
- Thus debt is usually cheaper than equity finance.
- Short-term loans are cheaper than long-term loans.
- The issue costs of debt are also lower than for equity.
(2)Gearing
- Debt is cheaper than equity but it has a hidden cost – as the level of debt increases the risk faced by the shareholders also increases. Thus their required return and hence the cost to the company will increase. Debt makes the equity more expensive.
- We therefore have two effects of increased gearing – on the positive side the debt is cheap finance, on the negative side the extra risk is bad for the shareholders.
- To see the net effect of gearing we need to look at theories of gearing – general consensus is that there is an optimal level of gearing that is best not exceeded.
(3)Control
- Debt does not usually convey voting rights. Neither do preference shares.
- A public issue of shares may change the balance of control.
- A rights issue will not change control, provided existing shareholders take up their rights. Legally, companies must offer new shares to existing shareholders first.
(4)Security
- Security is usually needed for debt.
- In a question you could look at the existing balance sheet for possible assets for security but watch for existing loans as assets may already be taken.
- Ideally assets will be land and buildings - quality assets, thus presenting a problem for service industries.
(5)Cash flow
- A general rule of thumb is to try to match the lifetimes of finance flows and project flows.
- If project cash flows are uncertain, then equity may be better as dividends may be cut if necessary.
- Fixed interest rates make budgeting easier than floating rates.
- Try to avoid loans maturing at the same time.
- In practice a cash flow forecast is essential.
(6)Availability
- Further debt may be restricted by agreements (covenants) in existing loans.
- Could shareholders afford a rights issue of the size suggested?
- Difficult to issue equity if unquoted.
(7)Exit routes
- Could the company repay the finance early? E.g. leases may include penalty clauses.
- Can investors get their money back early if they want to? Difficult if unquoted.
- Venture capitalists want their money back in 5-7 years.


 Test your understanding 2
In choosing between short-term and long-term borrowing, what should the management take into consideration?


 Test your understanding 3
What sources of finance are available to a public sector organisation?

Managing current and non-current assets
Managing assets can either be a source of short-term finance or aburden on short-term finance that raises overall funding requirements.
 Current assets are items that are either cash already or that will soonlead to the receipt of cash. Inventories will be sold to customers andcreate debtors and debtors will soon pay in cash for their purchases.
Non-current assets include fixed assets such as motor vehicles,plant and machinery, fixtures and fittings and land and buildings.Investments are also non-current assets.

 Managing cash
In the context of cash flows and liquidity, the following are risks that have to be managed:
- the risk that cash receipts will be lower than expected or that cash payments will be higher than expected, so that actual cash balances turn out to be much less than forecast
- the risk that when the business is faced with a cash shortage, it is unable to borrow the money it needs, or unable to raise more cash by selling off some of its assets
- the risk that when surplus cash is invested, the interest earned on the investment turns out to be much lower than it could have been.
The role of the cash manager is to monitor and control these risks,and to prevent them from threatening the survival of the business orhaving a significant impact on profitability.
The management of cash involves a trade off between:
- liquidity – having enough cash available to meet everyday demands
- profitability/cost – holding high balances of cash is costly in terms of lost investment interest; while unexpected deficits can be expensive if emergency funding is necessary.

5 Ratio analysis
Ratios
Ratio analysis is particularly useful for assessing whether astrategy is achieving its desired targets. Ratio analysis has alreadybeen covered in chapter 3.
Forecast ratios
In an examination question you may be asked to assess the implications of a proposed financing package and/or strategy.

 Test your understanding 4
Explain in what ways your approach to performance appraisal woulddiffer if you were asked to assess the performance of a not-for-profitorganisation.

6 The role of cost and management accounting
Cost accounting is an approach to evaluating the overall costs thatare associated with conducting business. Generally based on standardaccounting practices, cost accounting is one of the tools that managersutilize to determine what type and how much expenses is involved withmaintaining the current business model. At the same time, the principlesof cost accounting can also be utilized to project changes to thesecosts in the event that specific changes are implemented.
Standard cost card
Much of cost accounting is based on the principles ofstandardisation. It assumes that businesses operate in a stableenvironment where, for example, a standard amount of materials will beused in the production of each product and that a standard price can beattached to the price of those materials.

 Typical standard cost card
A typical standard cost card for a product might look as follows:
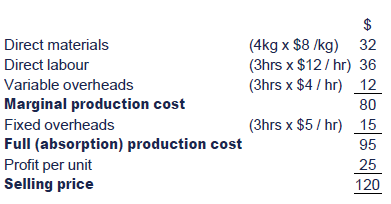
Marginal costs are all variable.

However, in a modern production environment, this may not always bethe case. Despite this, the remainder of this chapter relies heavily onstandard costing principles.

 Problems with standard costing in modern environments
Standard product costs are associated with traditional manufacturing systems producing large quantities of standard items.
Standard costing may not be appropriate in the modern production environment because:
Non-standard products
Standard product costs apply to manufacturing environments in whichquantities of an identical product are output from the productionprocess. They are not suitable for manufacturing environments whereproducts are non-standard or are customised to customer specifications.
Standard costs become outdated quickly
Shorter product life cycles in the modern business environment meanthat standard costs will need to be reviewed and updated frequently.This will increase the cost of operating a standard cost system but, ifthe standards are not updated regularly, they will be of limited use forplanning and control purposes. The extra work involved in maintainingup-to-date standards might limit the usefulness and relevance of astandard costing system.
Production is highly automated
It is doubtful whether standard costing is of much value forperformance setting and control in automated manufacturing environments.There is an underlying assumption in standard costing that control canbe exercised by concentrating on the efficiency of the workforce. Directlabour efficiency standards are seen as a key to management control.However, in practice, where manufacturing systems are highly automated,the rates of production output and materials consumption, are controlledby the machinery rather than the workforce.
Ideal standard used
Variances are the difference between actual performance andstandard, measured in cost terms. The significance of variances formanagement control purposes depends on the type of standard cost used.JIT and TQM businesses often implement an ideal standard due to theemphasis on continuous improvement and high quality. Therefore, adversevariances with an ideal standard have a different meaning from adversevariances calculated with a current standard.
Emphasis on continuous improvement
Standard costing and adherence to a preset standard is inconsistentwith the concept of continuous improvement, which is applied within TQMand JIT environments.
Detailed information is required
Variance analysis is often carried out on an aggregate basis (totalmaterial usage variance, total labour efficiency variance and so on)but in a complex and constantly changing business environment moredetailed information is required for effective management control.
Monitoring performance is important
Variance analysis control reports tend to be made available tomanagers at the end of a reporting period. In the modern businessenvironment managers need more 'real time' information about events asthey occur.

Contribution to sales ratios and breakeven points
Cost-Volume-Profit (CVP) analysis
CVP analysis makes use of the contribution concept in order to assess the following measures for a single product:
- contribution to sales (C/S) ratio
- breakeven point
- margin of safety
(Contribution = selling price less all variable costs)
C/S ratio
The C/S ratio of a product is the proportion of the selling pricethat contributes to fixed overheads and profits. It is comparable to thegross profit margin. The formula for calculating the C/S ratio of aproduct is as follows:

 The C/S ratio is sometimes referred to as the P/V (Profit/Volume) ratio.
Breakeven point
The breakeven point is the point at which neither a profit nor a loss is made.
- At the breakeven point the following situations occur.
Total sales revenue = Total costs, i.e. Profit = 0
or
Total contribution = Fixed costs, i.e. Profit = 0
- The following formula is used to calculate the breakeven point in terms of numbers of units sold.

- It is also possible to calculate the breakeven point in terms of sales revenue using the C/S ratio. The equation is as follows:

Margin of safety
The margin of safety is the amount by which anticipated sales (inunits) can fall below budget before a business makes a loss. It can becalculated in terms of numbers of units or as a percentage of budgetedsales.
The following formulae are used to calculate the margin of safety:


 Test your understanding 5
A break down of KP's profit in the last accounting period showed the following:

Due to a downturn in market conditions the company is worried thatnext year may result in losses and would like to know the change insales that would make this happen.
Calculate the break-even sales revenue for the business based onits current cost structure. Use this information to determine thepercentage fall in sales that would be necessary before the companywould begin to incur losses.
(5 marks)


 Limitations of break even analysis
The assumptions of break even analysis (which also therefore become its weaknesses) are:
- We are only considering the short term
- There is a constant contribution per unit
- There is a constant selling price
- There are constant variable costs per unit and constant fixed costs (so that it ignores stepped fixed costs)
- Sales = production so that there is no stock movement
- The objective is to maximise profit

Marginal analysis
Marginal analysis refers to situations where we use contribution to make decisions.
 The key is that only costs which vary with the decision should be included in an analysis of the decision.

 More details on relevant cost principles
Decision making involves making a choice between two or morealternatives. The decision will be 'rational'; profit maximising. Alldecisions will be made using relevant costs and revenues.
'Relevant costs are future cash flows arising as a direct consequence of the decision under consideration.'
There are three elements here:
Cash flows. To evaluate a decision actual cash flows shouldbe considered. Noncash items such as depreciation and interdivisionalcharges should be ignored.
Future costs and revenues. This means that past costs andrevenues are only useful insofar as they provide a guide to the future.Costs already spent, known as sunk costs, are irrelevant for decisionmaking.
Differential costs and revenues. Only those costs andrevenues that alter as a result of a decision are relevant. Wherefactors are common to all the alternatives being considered they can beignored; only the differences are relevant.
In many short run situations the fixed costs remain constant foreach of the alternatives being considered and thus the marginal costingapproach showing sales, marginal cost and contribution is particularlyappropriate.
In the long run (and sometimes in the short run) fixed costs dochange and accordingly the differential costs must include any changesin the amount of fixed costs.

Marginal analysis can be used in four key areas of decision making:
- accepting/rejecting special contracts
- determining the most efficient use of resources
- make-or-buy decisions
- closing/continuation decisions
Each of these will now be considered in turn.
Accepting/rejecting special contracts
The basic decision rule here is that we should calculate:
| Extra revenue received |
less marginal costs of meeting the special contract |
This would typically mean that items such as fixed costs,contracted costs etc. would be ignored in the decision as they would notbe affected by thedecision.
Determining the most efficient use of resources
Businesses often operate under short-term restrictions on resources(for example, staff time may be limited during a strike). Theytherefore may not be able to produce all products that make a positivecontribution and need to prioritise products and choose between them.
 The most profitable combination of products will occur where the contribution per usage of the scarce resource is maximised.

 Detailed technique
The usual objective in questions is to maximise profit. Given thatfixed costs are unaffected by the production decision in the short run,the approach should be to maximise the contribution earned.
If there is one limiting factor, then the problem is best solved using key factor analysis.
Step 1: identify the bottleneck constraint.
Step 2: calculate the contribution per unit for each product.
Step 3: calculate the contribution per unit of the bottleneck resource for each product.
Step 4: rank the products in order of the contribution per unit of the bottleneck resource.
Step 5: allocate resources using this ranking and answer the question.


 Test your understanding 6
X Ltd makes three products, A, B and C, of which unit costs, machine hours and selling prices are as follows:
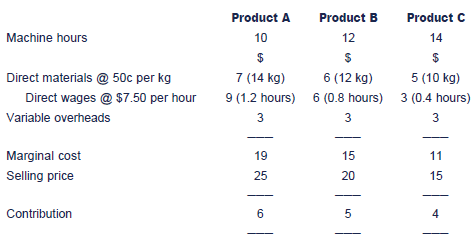
Sales demand for the period is limited as follows.

Company policy is to produce a minimum of 1,000 units of Product A.
The supply of materials in the period is unlimited, but machine hours are limited to 200,000 and direct labour hours to 5,000.
Required:
Indicate the production levels that should be adopted for the threeproducts in order to maximise profitability, and state the maximumcontribution.

Make-or-buy decisions
A product should be made in-house if the relevant cost of makingthe product in-house is less than the cost of buying the productexternally.
Spare capacity exists
Unless stated otherwise in the question, it should be assumed that there is spare capacity.

No spare capacity exists


 Test your understanding 7
A factory's entire machine capacity is used to produce essentialcomponents. The production costs of using the machines are as follows.

If all component production was outsourced, then the machines couldbe used to produce other items that would generate additionalcontribution of $50,000. Assume the fixed costs will still be incurredif production is outsourced.
What is the maximum price that the company should be willing to pay to the outside supplier for the components?

Closure or continuation decisions
Part of a business, for example a department or a product, mayappear to be unprofitable. The business may have to make a decision asto whether or not this area should be shut down.
The quantifiable cost or benefit of closure
The relevant cash flows associated with closure should be considered. For example:
- the lost contribution from the area that is being closed (= relevant cost of closure)
- savings in specific fixed costs from closure (=relevant benefit of closure)
- known penalties and other costs resulting from the closure, e.g. redundancy, compensation to customers (=relevant cost of closure)
- any known reorganisation costs (= relevant cost of closure)
- any known additional contribution from the alternative use for resources released (= relevant benefit of closure).
If the relevant benefits are greater than the relevant costs ofclosure then closure may occur. However, before a final decision is madethe business should also consider the non-quantifiable factorsdiscussed below.
Other issues to consider
The decision making processes above concentrated on the financialimpact of the decisions. Decision makers should also considerqualitative factors such as the impact on customers, competitiveadvantage and critical success factors etc.

 Example of other factors to consider
For example, let's consider the qualitative factors in a make-or-buy decision.
In addition to the relative cost of buying externally compared tomaking in-house, management must consider a number of other issuesbefore a final decision is made.
- Reliability of external supplier: can the outside company be relied upon to meet the requirements in terms of:
- quantity required
- quality required
- delivering on time
- price stability
- Specialist skills: the external supplier may possess some specialist skills that are not available in-house.
- Alternative use of resource: outsourcing will free up resources which may be used in another part of the business.
- Social: will outsourcing result in a reduction of the workforce? Redundancy costs should be considered.
- Legal: will outsourcing affect contractual obligations with suppliers or employees?
- Confidentiality: is there a risk of loss of confidentiality, especially if the external supplier performs similar work for rival companies.
- Customer reaction: Do customers attach importance to the products being made in-house?
Non-quantifiable costs and benefits of closure
There are qualitative factors to consider in all of the abovemarginal decisions. For example, the closure decision might have thefollowing qualitative factors:
- Some of the costs and benefits discussed above may be non-quantifiable at the point of making the shut-down decision:
- penalties and other costs resulting from the closure (e.g. redundancy, compensation to customers) may not be known with certainty.
- reorganisation costs may not be known with certainty.
- additional contribution from the alternative use for resources released may not be known with certainty.
- Knock-on impact of the shut-down decision. For example, supermarkets often stock some goods which they sell at a loss. This is to get customers through the door, who they then hope will purchase other products which have higher profit margins for them. If the decision is taken to stop selling these products then the customers may no longer come to the store.


 Test your understanding 8
KRS Ltd is considering whether to administer its own purchaseledger or to use an external accounting service. It has obtained thefollowing cost estimates for each option:
Internal service department
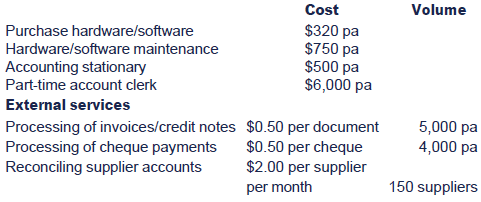
Determine the cost effectiveness of outsourcing the accounting activities and identify the qualitative factors involved.

7 Dealing with risk in decision making
There are many ways in which risk can be dealt with in decisionmaking. The most common technique is to attach probabilities to thepotential range of outcomes and calculate expected values from thisinformation.
Probabilities and expected values
 An expected value summarises all the different possible outcomes bycalculating a single weighted average. It is the long run average(mean).
The expected value is not the most likely result. It may not evenbe a possible result, but instead it finds the average outcome if thesame event was to take place thousands of times.

 Expected value calculations
It is unlikely that you will be expected to calculate expectedvalues in the exam, but you may be asked to comment on them or discusshow they could have been used.
Expected value formula

Example
A company expects the following monthly profits:
Calculate the expected value of monthly profit.
Solution
Expected profit is £13,000 per month.


 Test your understanding 9
A company's sales for a new product are subject to uncertainty. Ithas determined a range of possible outcomes over the first two years.
Year 1

Year 2

(if year 1 sales are high)

(if year 1 sales are low)
Required:
Calculate the expected sales for each year.


 Advantages and disadvantages of EVs
Advantages:
- Takes risk into account by considering the probability of each possible outcome and using this information to calculate an expected value.
- The information is reduced to a single number resulting in easier decisions.
- Calculations are relatively simple.
Disadvantages:
- The probabilities used are usually very subjective.
- The EV is merely a weighted average and therefore has little meaning for a one-off project.
- The EV gives no indication of the dispersion of possible outcomes about the EV, i.e. the risk.
- The EV may not correspond to any of the actual possible outcomes.

Decision trees and multi-stage decision problems
A decision tree is a diagrammatic representation of a decisionproblem, where all possible courses of action are represented, and everypossible outcome of each course of action is shown. Decision treesshould be used where a problem involves a series of decisions being madeand several outcomes arise during the decision-making process.
Decision trees force the decision maker to consider the logicalsequence of events. A complex problem is broken down into smaller,easier-to-handle sections. The financial outcomes and probabilities areshown separately, and the decision tree is 'rolled back' by calculatingexpected values and making decisions. It is important that only relevantcosts and revenues are considered, and that all cash is expressed inpresent value terms.

 Drawing decision trees
In the exam it will be important that you can undertsand andinterpret decision trees. You may also be expected to draw a simpledecision tree.
Three-step method

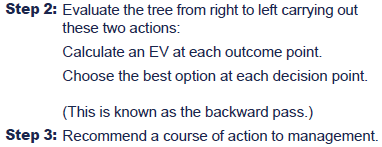


 Test your understanding 10
A company is planning on drilling for oil. It can either drillimmediately or carry out some preliminary tests. Alternatively, thecompany could sell the rights to the site to another company. It hascreated the following decision tree of the problem (all returns areshown in $m):
Required:
(a)Interpret the decision tree for management.
(b)Discuss the benefits of using decision trees.

8 Budgeting
 A quantitative or financial plan relating to the future. It can be forthe company as a whole or for departments or functions or products orfor resources such as cash, materials, labour, etc. It is usually forone year or less.
As part of 'strategy in action', a business will create plans foreach SBU, product, function etc. These plans are often in the form ofbudgets. The budget sets out the short-term plans an targets necessaryto fulfil the longer-term strategic plans and objectives.
The budgets will also play a vital role in reviewing andcontrolling strategic plans. They will be used to identify andinvestigate variances and to highlight when a plan or process is 'out ofcontrol'.
Budgets are distinct from forecasts. A forecast is a prediction of afuture outcome. A budget is a plan (usually in financial terms) thatlooks to use and/or achieve that forecast.
Purposes of budgeting
Budgets have several different purposes:
(1)Planning
(2)Control
(3)Co-ordination
(4)Communication
(5)Motivation
(6)Evaluation
(7)Authorisation

 Purposes of budgets explained
Budgets have several different purposes:
(1) Planning
Budgets compel planning. Thebudgeting process forces management to look ahead, set targets,anticipate problems and give the organisation purpose and direction.Without the annual budgeting process the pressures of day-to-dayoperational problems may tempt managers not to plan for futureoperations. The budgeting process encourages managers to anticipateproblems before they arise, and hasty decisions that are made on thespur of the moment, based on expediency rather than reasoned judgements,will be minimised. Corporate planners would regard budgeting as animportant technique whereby long-term strategies are converted intoshorter-term action plans.
(2) Control
The budget provides the plan against whichactual results can be compared. Those results which are out-of-line withthe budget can be further investigated and corrected.
(3) Co-ordination
The budget serves as a vehicle throughwhich the actions of the different parts of an organisation can bebrought together and reconciled into a common plan. Without any guidancemanagers may each make their own decisions believing that they areworking in the best interests of the organisation. A sound budgetingsystem helps to co-ordinate the different activities of the business andto ensure that they are in harmony with each other.
(4) Communication
Budgets communicate targets to managers.Through the budget, top management communicates its expectations tolower-level management so that all members of the organisation mayunderstand these expectations and can co-ordinate their activities toattain them.
(5) Motivation
The budget can be a useful device forinfluencing managerial behaviour and motivating managers to perform inline with the organisational objectives.
(6) Evaluation
The performance of a manager is oftenevaluated by measuring his success in achieving his budgets. The budgetmight quite possibly be the only quantitative reference point available.
(7) Authorisation
A budget may act as formal authorisation toa manager for expenditure, the hiring of staff and the pursuit of theplans contained in the budget.

Functional budgets and the master budget
A master budget for the entire organisation brings together thedepartmental or activity budgets for all the departments orresponsibility centres within the organisation.
The structure of a budget depends on the nature of the organisationand its operations. In a manufacturing organisation, the budgetingprocess will probably consist of preparing several functional budgets,beginning with a sales budget.

 Functional budgets
- Sales budget. Budget for future sales, expressed in revenue terms and possibly also in units of sale. The budget for the organisation as a whole might combine the sales budgets of several sales regions.
- Production budget. A production budget follows on from the sales budget, since production quantities are determined by sales volume. The production volume will differ from sales volume by the amount of any planned increase or decrease in inventories of finished goods (and work-in-progress).
In order to express the production budget in financial terms(production cost), subsidiary budgets must be prepared for materials,labour and production overheads. Several departmental managers could beinvolved in preparing these subsidiary budgets.
- Direct materials usage budget. This is a budget for the quantities and cost of the materials required for the planned production quantities.
- Materials purchasing budget. This is a budget for the cost of the materials to be purchased in the period. The purchase cost of direct materials will differ from the material usage budget if there is a planned increase or decrease in direct materials inventory. The purchases budget should also include the purchase costs of indirect materials.
- Direct labour budget. This is a budget of the direct labour costs of production. If direct labour is a variable cost, it is calculated by multiplying the production quantities (in units) by the budgeted direct labour cost per unit produced. If direct labour is a fixed cost, it can be calculated by estimating the payroll cost.
- Production overheads. Budgets can be produced for production overhead costs. Where a system of absorption costing is used, overheads are allocated and apportioned, and budgeted absorption rates are determined.
- Administration and sales and distribution overheads. Other overhead costs should be budgeted.
- Budgeted income statement, cash budget and balance sheet. Having prepared budgets for sales and costs, the master budget can be summarised as an income statement for the period, a cash budget (or cash flow forecast) and a balance sheet as at the end of the budget period.
If the budgeted profit, cash position or balance sheet areunsatisfactory, the budgets should be revised until a satisfactoryplanned outcome is achieved.
The stages in budget preparation are illustrated in the following diagram:

Principal budget factor
It is usually assumed in budgeting that sales demand will be thekey factor setting a limit to what the organisation can expect toachieve in the budget period. Occasionally, however, there might be ashortage of a key resource, such as cash, raw material supplies, skilledlabour or equipment. If a resource is in restricted supply, and theshortage cannot be overcome, the budget for the period should bedetermined by how to make the best use of this key budget resource,rather than be sales demand.
When a key resource is in short supply and affects the planning decisions, it is known as the principal budget factor or limiting budget factor.
Meaningful budgetary control
Budgetary control refers to not only the budget setting process butalso to the monitoring of ongoing performance against these budgets.For this second process to be useful the budgets themselves must beaccurate, reliable and up to date.

 Why budgets may not be useful for control purposes
There are two reasons why this might not be the case. Firstly, itmay well be that the organisation's environment has changed but that thebudget has not been adapted to reflect this. For example, if a budgetis based on a 30% forecasted increase in sales but perhaps a change inlegislation means that the product is no longer as attractive and salesare now only forecasted to rise by 5%. In this case the budget should bechanged in order to reflect the change in the organisation'senvironment. Without a change to the budget the organisation would lookto be out of control and unnecessary actions and investigations would beimplemented.
The second reason why the budget itself may not be useful for control purposes is due to the behavioural aspects of budgeting.

Behavioural aspects of budgets
As mentioned above, one of the purposes of budgets is to achievemotivation. There are therefore a number of factors to consider inrelation to this:
- the level of difficulty in the budget,
- the links to the organisation's objectives, and
- the level of staff involvement.

 Further details
- the level of difficulty in the budget. Budgets should be realistic and just tough enough so that they do not demotivate by being too difficult or present a lack of motivation by being too easy.
- the links to the organisation's objectives. As already discussed, budgets should be linked to objectives to ensure that they motivate managers and staff to achieve those objectives rather than any other objectives (such as their own).
- the level of staff involvement. Involving staff in budgets provides a responsibility that is often linked to strong motivation. On the other hand, the business must be wary of any slack that managers might want to build into budgets in which they have both an input and a responsibility.

Making budgetary control effective
Atrill and McLaney identify a number of characteristics that are common to businesses with effective budgetary control:
- a serious attitude is taken to the system
- clear demarcation between areas of managerial responsibility
- budget targets that are challenging yet achievable
- established data collection, analysis and reporting techniques
- reports aimed at individual managers
- fairly short reporting periods
- timely variance reports
- action being taken to get operations back under control if they are shown to be out of control.
9 Variance analysis
An effective part of budgetary control is to calculate and investigate variances from the budget.
Flexed budgets
Before any meaningful comparison can be made the original budget should be 'flexed' to the actual level of performance.

 Example of a flexed budget
A company has a standard cost of $8 per unit for materials andexpects to produce and sell 20,000 units (ignore any changes tomaterials stock). It sets a materials budget for the purchasingdepartment of $160,000 in total.
During the year, because of a celebrity endorsement, the productbecome very popular and actual sales and production are 30,000 units(50% above what was originally expected). The purchasing department hasspent $220,000 on materials and is very concerned about the massiveoverspend in their department.
It makes sense that the materials budget for the purchasingdepartment should not be limited to the original $160,000 as now it willhave had to buy a lot extra materials. So instead the original budgetis adjusted (or flexed) to reflect the increase in actual level ofactivity.


Variance groups
Variances can be divided into three main groups:
- sales variances
- variable cost variances
- material variances
- labour variances
- variable overhead variances
- fixed overhead variances

 Variance calculations
Sales price variance
A sales price variance shows the effect on profit of the differencebetween the standard sales prices for the items sold in a period andthe actual sales revenue achieved. It is calculated as follows:
(a)Standard selling price multiplied by the actual number of units sold, and
(b)Actual selling price multiplied by the actual number of units sold.
Sales volume profit variance
The sales volume margin variance is the difference between actualand budgeted sales volumes valued at either standard profit, in anabsorption costing system, or standard contribution in a marginalcosting system.
Direct material total variance
The difference between:
(a)the standard direct material cost of the actual production and
(b)the actual cost of direct material.
Direct material price variance
The difference between:
(a)standard purchase price per kg and
(b)actual purchase price
multiplied by the actual quantity of material purchased or used.
Note that the material price variance can be calculated eitherat the time of purchase or at the time of usage. Generally, the formeris preferable.
Direct material usage variance
The difference between:
(a)the standard quantity of material specified for the actual production and
(b)the actual quantity used
multiplied by the standard purchase price.
Direct labour total cost variance
The difference between:
(a)the standard direct labour cost of the actual production and
(b)the actual cost of direct labour.
Direct labour rate variance
The difference between:
(a)standard rate per hour and the
(b)actual rate per hour
multiplied by the actual hours that were paid for.
Direct labour efficiency variance
The difference between:
(a)the standard hours specified for the actual production and
(b)the actual hours worked
multiplied by the standard hourly rate.
Variable production overhead total cost variance
The difference between:
(a) the standard variable overhead cost of the actual production and
(b) the actual cost of variable production overheads.
Variable production overhead expenditure variance
Variable production overhead efficiency variance
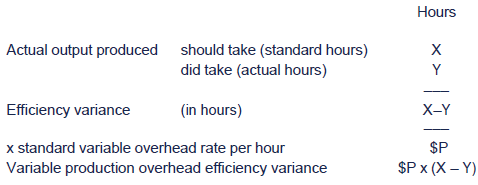
Fixed overhead total variance
In standard absorption costing, the total cost variance for fixedproduction overhead variances is the amount of over-absorbed orunder-absorbed overhead. Over-absorbed overhead is a favourablevariance, and under-absorbed overhead is an adverse variance.
The amount of overhead absorbed for each unit of output is thestandard fixed overhead cost per unit. The total cost variance istherefore calculated as follows:
The difference between:
(a)the standard fixed overhead cost of the actual production and
(b)the actual fixed overheads incurred
Fixed overhead expenditure variance
The difference between:
(a)Budgeted Fixed Cost and
(b)Actual Fixed Cost
Fixed production overhead volume variance
A fixed production overhead volume variance represents the amountof fixed overhead that has been under- or over-absorbed due to the factthat actual production volume differed from the budgeted productionvolume.
The volume variance is calculated as the difference between:
(a) Budgeted output in units and
(b) Actual output in units
multiplied by the Standard Fixed Overhead Cost per unit
The fixed overhead volume variance does not occur in a marginal costing system.


 Test your understanding 11
Sam Mendes Ltd is a manufacturing company which produces a varietyof products. The following information relates to one of its products– Product W:

The budgeted production is 24,000 units per annum evenly spreadthroughout the year, with each calendar month assumed to be equal. Marchis a bad month in terms of sales revenue and it is expected that saleswill only be 1,700 units during the month. Fixed overheads were expectedto be $144,000 per year and are absorbed on a labour hour basis.
Actual results for the month of March were that sales were 2,200units at a price of $90. There was no change in stock of finished goodsor raw materials.
The purchases during the month were 11,300 kg of material X at $2.80 per kg and 8,300 kg of material Y at $5.30 per kg.
4,800 labour hours were worked at a rate of $8.10 per hour and 1,600 hours at $8.30
The actual variable overheads for the period were $33,000 and the fixed overheads were $12,500
The company uses an absorption costing system and maintains its raw materials account at standard.
Required:
Calculate appropriate variances for the month of March in as muchdetail as possible and present an operating statement reconcilingbudgeted profit with actual profit.
You are not required to calculate mix or yield variances as SamMendes Ltd does not sub-analyse the material usage or labour efficiencyvariances.

Variance investigation
Variances arise naturally in standard costing because a standardcost is a long term average cost. In any period actual costs may behigher or lower than standard but in the long run these should cancelout if the process is under control.
Variances may also arise because of:
- poor budgeting
- poor recording of cost
- operational reasons (the key emphasis in exam questions)
- random factors.
It is important to identify the reason for a variance so thatappropriate action can be taken, but time and effort will be wasted ifall variances are investigated as many will arise as a normal part ofthe process.
When should a variance be investigated?
Factors to consider include the following:
- the size of the variance
- whether favourable/adverse – firms often treat adverse variances as more important than favourable
- correction costs versus benefits
- ability to correct
- past pattern
- budget reliability
- reliability of measurement/recording systems.

 Variance investigation techniques
Reporting by exception
Variance reports might identify significant variances. This is aform of reporting by exception, in which particular attention is givento the aspects of performance that appear to be exceptionally good orbad.
Alternatively, a rule might be applied generally that any adversevariance or favourable variance should be investigated if it exceedsmore than a given percentage amount of the standard cost. For example, arule might be applied that all adverse variances exceeding 5% ofstandard cost should be investigated and all favourable variancesexceeding 10% of the standard should also be investigated.
Cumulative variances and control charts
An alternative method of identifying significant variances is toinvestigate the cause or causes of a variance only if the cumulativetotal for the variance over several control periods exceeds a certainlimit.
The reason for this approach is that variances each month mightfluctuate, with adverse variances in some months and favourablevariances in the next. Provided that over time, actual results remainclose to the standard, monthly variances might be acceptable.
For example, actual fixed overhead expenditure will not be exactlythe same every month. Budgeted monthly expenditure, on the other hand,might be calculated by dividing the budgeted annual expenditure by 12.Consequently, there will inevitably be favourable or adverse expenditurevariances from one month to the next, although over the course of thefinancial year, actual and budgeted expenditure should be the same.
This approach to identifying significant variances can beillustrated by the concept of a variance control chart. Variances shouldonly be investigated when the cumulative total of variances exceedspredetermined control limits.
Setting the control limits
The control limits used as a basis for determining whether avariance should be investigated may be set statistically based on thenormal distribution.
Using historical data a standard can be set as an expected averagecost and a standard deviation can also be established. By assuming that acost conforms to the normal distribution a variance will beinvestigated if it is statistically significant and has not arisenaccording to chance.
- If a company has a policy to investigate variances that fall outside the range that includes 95% of outcomes, then variances which exceed 1.96 standard deviations from the standard would be investigated.
- If a company has a policy to investigate variances that fall outside the range that includes 99% of outcomes, then variances which exceed 2.58 standard deviations from the standard would be investigated.

For control purposes, management might need to establish why aparticular variance has occurred. Once the reason for the variance hasbeen established, a decision can then be taken as to what controlmeasures, if any, might be appropriate:
- to prevent the adverse variance continuing in the future, or
- to repeat a favourable variance in the future, or
- to bring actual results back on course to achieve the budgeted targets.

 Possible operational causes of variances
Possible operational causes of variances are as follows:
Material price
(1)Using a different supplier, who is either cheaper or more expensive.
(2)Buying in larger-sized orders, andgetting larger bulk purchase discounts. Buying in smaller-sized ordersand losing planned bulk purchase discounts.
(3)An unexpected increase in the prices charged by a supplier.
(4)Unexpected buying costs, such as high delivery charges.
(5)Efficient or inefficient buying procedures.
(6)A change in material quality, resulting in either higher or lower purchase prices.
Material usage
(1)A higher-than-expected or lower-than-expected rate of scrap or wastage.
(2)Using a different quality of material (higher or lower quality) could affect the wastage rate.
(3)Defective materials.
(4)Better quality control.
(5)More efficient work procedures, resulting in better material usage rates.
(6)Changing the materials mix to obtain a more expensive or less expensive mix than the standard.
Labour rate
(1)An unexpected increase in basic rates of pay.
(2)Payments of bonuses, where these are recorded as direct labour costs.
(3)Using labour that is more or less experienced (and so more or less expensive) than the 'standard'.
(4)A change in the composition of the work force, and so a change in average rates of pay.
Labour efficiency
(1)Taking more or less time than expected to complete work, due to efficient or inefficient working.
(2)Using labour that is more or less experienced (and so more or less efficient) than the 'standard'.
(3)A change in the composition or mix of the work force, and so a change in the level of efficiency.
(4)Improved working methods.
(5)Industrial action by the work force: 'working to rule'.
(6)Poor supervision.
(7)Improvements in efficiency due to a 'learning effect' amongst the work force.
(8)Unexpected lost time due to production bottlenecks and resource shortages.
Overhead variances
(1)Fixed overhead expenditure adversevariances are caused by spending in excess of the budget. A moredetailed analysis of the expenditure variance would be needed toestablish why actual expenditure has been higher or lower than budget.
(2)Variable production overhead efficiency variances: the causes are similar to those for a direct labour efficiency variance.
Sales price
(1)Higher-than-expected discounts offered to customers to persuade them to buy, or due to purchasing in bulk.
(2)Lower-than-expected discounts, perhaps due to strength of sales demand.
(3)The effect of low-price offers during a marketing campaign.
(4)Unexpected price increases.
(5)Unexpected price cuts.
Sales volume
(1)Successful or unsuccessful direct selling efforts.
(2)Successful or unsuccessful marketing efforts (for example, the effects of an advertising campaign).
(3)Unexpected changes in customer needs and buying habits.
(4)Failure to satisfy demand due to production difficulties.
(5)Higher demand due to a cut in selling prices, or lower demand due to an increase in sales prices.

Possible interdependence between variances
In many cases, the explanation for one variance might also explainone or more other variances in which case the variances areinter-related.
For control purposes, it might therefore be necessary to look at several variances together and not in isolation.

 Examples of interdependent variances
Some examples of interdependence between variances are listed below.

The controllability principle
Controllability means the extent to which a specific manager cancontrol costs or revenues or any other item (such as output quality).The controllability principle is that a manager should only be madeaccountable and responsible for costs and revenues that he or she cancontrol directly.
In variance reporting, this means that variances should be reportedto the managers who are in a position to control the costs or revenuesto which the variances relate.

 Composite variances
Sometimes a variance might be caused by a combination of twofactors. The variance is a composite variance, because it is the resultof the two factors combined. To apply the controllability principle, thevariance should be reported to each of the managers who are in aposition to control one of the factors.

10 Chapter summary
Test your understanding answers

 Test your understanding 1
Strategic and operational decisions
The major change in emphasis will be that decisions will now haveto be made on a largely commercial basis. Profit and share priceconsiderations will become paramount. Examples of where significantchanges might occur are:
- financing decision: The firm will have to compete for a wide range of sources of finance. Choices between various types of finance will now have to be made, e.g. debt versus equity
- dividend decision: The firm will now have to consider its policy on dividend payout to shareholders
- investment decision: Commercial rather than social considerations will become of major importance. Diversification into other products and markets will now be possible. Expansion by merger and take-over can also be considered
- threat of take-over: If the government completely relinquishes its ownership it is possible that the firm could be subject to take-over bids
- other areas: Pricing, marketing, staffing, etc., will now be largely free of government constraints.


 Test your understanding 2
Normally, but not invariably, long-term finance is more expensivethan short-term finance. This is because lenders normally perceive therisks as being higher on long-term advances.
Long-term finance does, however, carry the advantage of security,whereas sources of short-term finance can often be withdrawn at shortnotice.
Short-term loans have to be regularly renewed and the companycarries the risk that lenders may refuse to extend further credit. Thisrisk is at its highest on overdraft borrowing where the bank can call inthe overdraft 'on demand'.
With long-term borrowing, as long as the borrower does not breachthe debt covenants involved, the finance is assured for the duration ofthe loan.
In choosing between short-term and long-term borrowing, the firmshould consider the textbook rule of thumb for prudent financing:'finance short-term investments with short-term funds and long-terminvestments with long-term funds'. Simply, this means use cheapshort-term borrowing where it is safe to do so (investments that areshort-term in nature and hence renewal risk is not a problem) but uselong-term finance for long-lived investments.


 Test your understanding 3
- Taxation of incomes and company profits, excise, VAT receipts (central government).
- Sale of gilts (government securities) to investors.
- Borrowing from external sources (e.g. issuing Eurobonds).
- Community charge (local government).
- User fees (e.g. charge for using a leisure facility).
- Special charges (e.g. the nuclear levy on electricity bills).
- Charging overseas users (e.g. universities for overseas students).
- Charges to private sector (e.g. the NHS charges for using some of its facilities).
- Funds from central government.
- Issuing municipal bonds (on the money markets).
- Long-term loan finance (e.g. for local authorities).


 Test your understanding 4
Solution
It is generally assumed that the objective of stock market listedcompanies is to maximise the wealth of their shareholders. This in turnplaces an emphasis on profitability and other factors that influence acompany's share price. It is true that some companies have other(secondary) aims such as only engaging in ethical activities (e.g. notproducing armaments) or have strong environmental considerations.Clearly by definition, not-for-profit organisations are not motivated bythe need to produce profits for shareholders, but that does not meanthat they should be inefficient. Many areas of assessment ofprofit-oriented companies are perfectly valid for not-for-profitorganisations: efficient stock holdings, tight budgetary constraints,use of key performance indicators, prevention of fraud, etc.
There are a great variety of not-for-profit organisations; e.g.public sector health, education, policing and charities. It is difficultto be specific about how to assess the performance of a not-for-profitorganisation without knowing what type of organisation it is. In generalterms an assessment of performance must be made in the light of thestated objectives of the organisation. Thus, for example, in a publichealth service one could look at measures such as treatment waitingtimes, increasing life expectancy, etc. and although such organisationsdo not have a profit motive requiring efficient operation, they shouldnonetheless be accountable for the resources they use. Techniques suchas 'value for money' and the three Es (economy, efficiency andeffectiveness) have been developed and can help to assess theperformance of such organisations.


 Test your understanding 5
Firstly we need to calculate the break even sales revenue.
Because we haven't been given any information on units, we must have to use the contribution sales revenue technique:

= 0.511 (or 51.1%)
Now that we know the break-even position we can calculate themargin of safety (this is what is required in the second element of thequestion).

This tells us that for the company to fall into a loss makingposition its sales next year would have to fall by over 30.44% fromtheir current position.


 Test your understanding 6
Step 1: Identify the bottleneck constraint.(this may be done for you in examination questions).
At potential sales level:

Thus, labour hours are the limiting factor.
Step 2: calculate the contribution per unit for each product.
This has been done for us in the question
Step 3: calculate the contribution per unit of the bottleneck resource for each product, i.e. per labour hour
Product A $6/ 1.2 = $5.00
Product B $5/0.8 = $6.25
Product C $4/0.4 = $10.00
Step 4: rank the products in order of the contribution per unit of the bottleneck resource.
Thus, production should be concentrated first on C, up to the maximum available sales, then B, and finally A.
However, a minimum of 1,000 units of A must be produced.
Step 5: allocate resources using this ranking and answer the question, i.e. state the maximum contribution.
Taking these factors into account, the production schedule becomes:

The maximum contribution is therefore as follows.
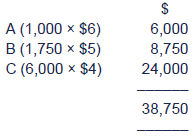


 Test your understanding 7
Solution


 Test your understanding 8
Annual internal processing costs

Annual outsourcing costs

It would not be cost effective to outsource the accounting activities. The present costs of $7,570 would rise to $8,100 pa
Qualitative factors include:
- predicted volumes – higher volumes will make outsourcing more expensive
- the quality of supply – will the external supplier make more errors?
- security of information.


 Test your understanding 9
Year 1
Expected value = ($40 × 60%) + ($20 × 40%) = $32m.
Year 2


 Test your understanding 10
(a)It is easier to start at the bottomof the tree. The first box shows the first decision to be made – totest, to drill or to sell the rights. If we follow the 'drill'line/branch, we come a 'chance' point (represented by a circle). Thisshows that if we drill there are two possible outcomes – there is a55% that we find oil and make a positive net return of $150m. There isalso a 45% that no oil is found and that no return is made. The figureon the circle of $82.5m is the expected value calculated from these twooutcomes. However, the drill line has a cost of $50m so that the overallnet expected return would be $32.5m – and it is this figure thatshould be used to compare the drill option against the other options.
The middle branch of the tree shows the expected value from selling the rights – $40m.
The top branch shows the analysis of the testing decision. Itcan be seen that there are many more possible outcomes and also furtherdecisions to made based on whether or not the tests indicate thepresence of oil. Lines that have a double cross marking on them show thebest choice to be made based on expected values.
Advice:
The company should undertake geological tests. If the testsindicate that oil is present then a drilling programme should be carriedout. However, if the tests indicate that there is no oil then thecompany should sell the drilling rights.
This strategy will maximise expected returns at £43.5m.
(b)The main value of a decision tree isthat it maps out clearly all the decisions and uncertain events andexactly how they are interrelated. They are especially beneficial wherethe outcome of one decision affects another decision. For example in theabove, the probability of eventual success changes depending on thetest outcomes. The analysis is made clearer by annotating the tree withprobabilities, cash flows, and expected values so that the optimumdecisions (based on expected values) can be clearly seen.
However, drawing a tree diagram is only one way of undertaking adecision. It is based on the concept of expected value and as suchsuffers from the limitations of this technique. For example, in thisexample, if the test drilling proves positive, the tree indicated thecompany should drill, as opposed to selling the rights. But if it doesthere is a 20% chance of it losing £50 million. A risk-averse companymay well decide to accept the safer option and sell the rights andsettle for £65 million.


 Test your understanding 11
Standard product cost
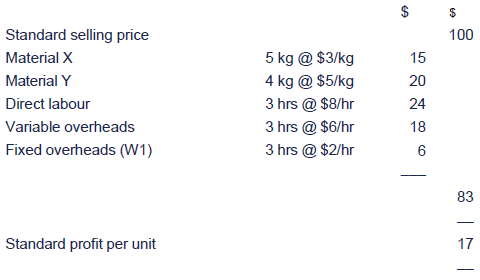
There are many different ways to calculate variances, of which the following is one alternative.
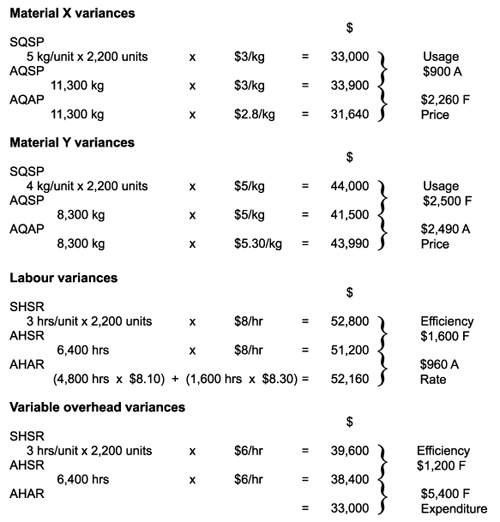
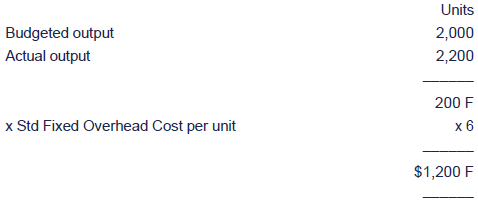
Fixed overhead expenditure variance

Fixed overhead volume variance
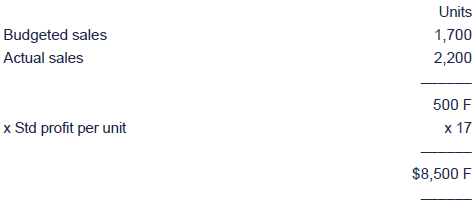
Sales volume profit variance
Sales price variance
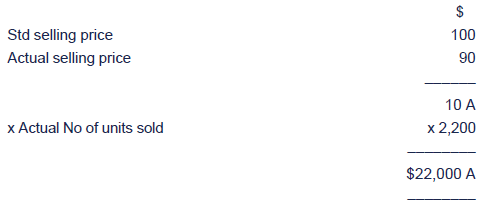
Operating statement
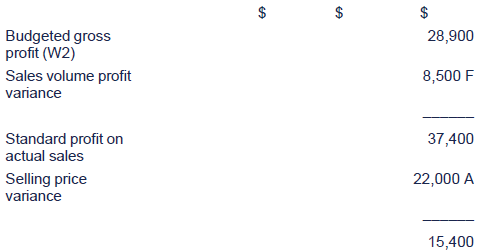
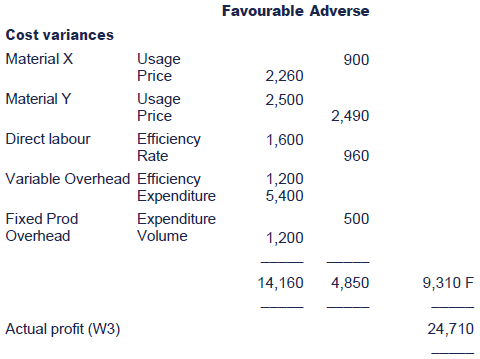
Workings
(W1)
Budgeted fixed overheads are $144,000 per yearand the budgeted output is 24,000 units for the year. Thus thebudgeted/standard fixed cost per unit is $6.
The overheads are absorbed on direct labour hours and each unittakes 3 hours. Therefore the budgeted/standard fixed overhead is $2 perhour ($6 ÷ 3 hours).
(W2)
Budgeted profit = $17 per unit x Budgeted sales of 1,700 units = $28,900
(W3)


|
Created at 5/24/2012 12:58 PM by System Account
(GMT) Greenwich Mean Time : Dublin, Edinburgh, Lisbon, London
|
Last modified at 5/25/2012 12:55 PM by System Account
(GMT) Greenwich Mean Time : Dublin, Edinburgh, Lisbon, London
|
|
|
|
 |
Rating
:
|
 Ratings & Comments
(Click the stars to rate the page) Ratings & Comments
(Click the stars to rate the page)
|
 |
Tags:
|
|