Chapter 15: The cost of capital
Chapter learning objectives
Upon completion of this chapter you will be able to:
- explain the relationship between risk and return in financial investments
- explain the nature and features of different securities in relation to the risk/return trade-off
- explain the relative risk/return relationship of debt and equity and the effect on their relative costs
- describe the creditor hierarchy and its connection with the relative costs of sources of finance
- calculate a share price using the dividend valuation model (DVM)
- calculate cost of equity using the DVM
- calculate dividend growth using the dividend growth model (DGM)
- discuss the weaknesses of the DVM
- define and distinguish between systematic and unsystematic risk
- explain the relationship between systematic risk and return and describe the assumptions and components of the capital asset pricing model (CAPM)
- use the CAPM to find a company's cost of equity
- explain and discuss the advantages and disadvantages of the CAPM
- calculate the cost of finance for irredeemable debt, redeemable debt, convertible debt, preference shares and bank debt
- define and distinguish between a company's average and marginal cost of capital
- calculate an appropriate WACC for a company in a scenario, identifying the relevant data.
1 The overall approach
We have seen that when appraising investment projects, a firm mayevaluate a project's returns using the company's cost of finance (alsocalled the discount rate or cost of capital) to establish the netpresent value (NPV).
Within the sources of finance chapter we identified the main sources of long term finance within a company as:
- equity (or ordinary shares)
- preference shares
- debt
We also briefly explored the relationship between risk and return.Here we concluded that the greater the risk of an investment, thegreater return would be demanded by the investor. The total returndemanded by an investor is actually dependent on two specific factors:
- the reward investors demand for the risk they take in advancing funds to the firm
- the prevailing risk-free rate (Rf) of return.
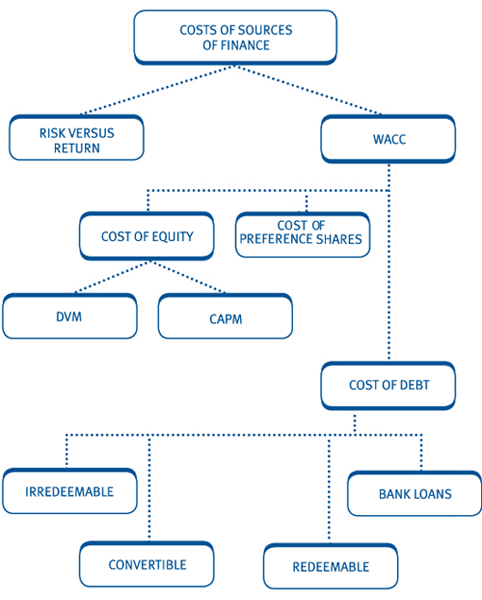
This session will build on all of this by looking at how a firm canidentify their overall cost of finance using the technique below:
 This is the key approach for finding a company's WACC in examination questions.
Calculating returns
The cost of each source of finance to the company can be equatedwith the return which the providers of finance (investors) are demandingon their investment.
This return can be expressed as a percentage (effectively, aninterest rate) that can be used as the overall measure of cost, i.e. thecost of money is the percentage return a firm needs to pay itsinvestors.
To calculate the return being demanded, we will assume that in a perfect market:

This is the base premise that will be assumed for all of the subsequent workings in our cost of capital calculation.
2 Estimating the cost of equity – the Dividend Valuation Model (DVM)
 The cost of equity finance to the company is the return the investors expect to achieve on their shares.
Using our base premise outlined above, we will be able to determinewhat return investors expect to receive by looking at how much they areprepared to pay for a share.
Assumptions:
 DVM states that:
- Future income stream is the dividends paid out by the company
- Dividends will be paid in perpetuity
- Dividends will be constant or growing at a fixed rate.
Therefore:
- Share price = Dividends paid in perpetuity discounted at the shareholder's rate of return.
 Adiscussion of the DVM and its assumptions is likely to be required inan examination question that asks you to calculate cost of equity.
DVM (assuming constant dividends)
 The formula for valuing a share is therefore:
where:
D = constant dividend from year 1 to infinity
Po = share price now (year 0)
re= shareholders' required return, expressed as a decimal.
For a listed company, since the share price and dividend paymentare known, the shareholder's required return can be found by rearrangingthe formula:

 Test your understanding 1 – DVM no growth
A company has paid a dividend of 30c for many years. The companyexpects to continue paying dividends at this level in the future. Thecompany's current share price is $1.50.
Calculate the cost of equity.

DVM (assuming dividend growth at a fixed rate)
 Although in reality a firm's dividends will vary year on year, apractical assumption is to assume a constant growth rate in perpetuity.
The share valuation formula then becomes:
where:
g = constant rate of growth in dividends, expressed as a decimal
D1 = dividend to be received in one year – i.e. at T1
Do(1+g) = dividend just paid, adjusted for one year's growth.
Therefore to find the cost of equity the formula can be rearranged to:

 Test your understanding 2 – DVM with growth
P Co has just paid a dividend of 10c. Shareholders expect dividends to grow at 7% pa. P Co's current share price is $2.05.
Calculate the cost of equity of P Co.


 Test your understanding 3 – DVM with growth
A company has recently paid a dividend of $0.23 per share. The current share price is $3.45.
If dividends are expected to grow at an annual rate of 3%, calculate the cost of equity.

Note how the terms re (the shareholder's required return) and ke (the cost of equity) can be used interchangeably. Don't let this terminology put you off.
The ex-div share price
The DVM model is based on the perpetuity formula, which assumesthat the first payment will arise in one year's time (i.e. at the end ofyear 1). A share price quoted on this basis is termed an ex div shareprice.
If the first dividend is receivable immediately, then the share istermed cum div. In such a case the share price would have to beconverted into an ex div share price, i.e. by subtracting the dividenddue for payment.
Po represents the 'ex div' share price. A question maygive you the cum div share price by stating that the dividend is to bepaid shortly.
 Cum div share price – dividend due = Ex div share price.

 The ex div share price
Dividends are paid periodically on shares. During the period priorto the payment of dividends, the price rises in anticipation of thepayment. At this stage the price is cum div.
Sometime after the dividend is declared the share becomes ex div, and the price drops. This may be expressed diagrammatically:
It will be noted that the share goes ex div shortly before thedividend is paid. Any person acquiring the share after this point intime will not receive the dividend, which will be paid to the originalshareholder. The reason is that the time it takes for the company toamend its register of members requires a cut-off point somewhat beforethe dividend is paid.
Thus, when a share is quoted cum div, the price includes both the underlying ex div value of the share (Po), and the dividend due shortly (Do).
Use of the dividend valuation model and the formulae developed thus far requires an ex div share price to determine the Po value.


 Test your understanding 4 – The ex-div share price
The current share price is 140c and a dividend of 8c is due to be paid shortly.
Required:
Calculate the value of Po, the ex-div share price.


 Test your understanding 5 – The ex div share price
D Co is about to pay a dividend of 15c. Shareholders expect dividends to grow at 6% pa. D Co's current share price is $1.25.
Calculate the cost of equity of D Co.

Estimating growth
Two ways of estimating the likely growth rate of dividends are:
- extrapolating based on past dividend patterns
- assuming growth is dependent on the level of earnings retained in the business
Past dividends
This method assumes that the past pattern of dividends is a fair indicator of the future.
 The formula for extrapolating growth can be written as:

where:
n = number of years of dividend growth.

 Test your understanding 6 – Using past dividends
A company currently pays a dividend of 32c; five years ago the dividend was 20c.
Estimate the annual growth rate in dividends.


 Test your understanding 7 – Using past dividends
A company has paid the following dividends per share over the last five years.

Calculate the average annual historical growth rate.

The earnings retention model (Gordon's growth model)
Assumption
- The higher the level of retentions in a business, the higher the potential growth rate.
The formula is therefore:
g = bre
where:
re= accounting rate of return
b = earnings retention rate.

 Test your understanding 8 – The earnings retention model
Consider the following summarised financial statement for XYZ Co
Statement of financial position as at 31 December 20X5

Profits after tax for the year ended 31 December 20X6 $20
Dividend (a 40% payout) $8
Statement of financial position as at 31 December 20X6

If the company's return on equity and earnings retention rateremain the same, what will be the growth in dividends in the next year(20X7)?


 Test your understanding 9 – The earnings retention model
A company is about to pay an ordinary dividend of 16c a share. Theshare price is 200c. The accounting rate of return on equity is 12.5%and 20% of earnings are paid out as dividends.
Calculate the cost of equity for the company.

Weaknesses of the DVM
The DVM has a sound basic premise. The weaknesses occur because:
- the input data used may be inaccurate:
- current market price
- future dividend patterns
- the growth in earnings is ignored.
 Make sure you can challenge the assumptions of the DVM for an examination question.

 Weaknesses of the DVM
Few would argue with the basic premise of the model that the valueof a share is the present value of all its future dividends. Its majorweakness stems from limitations in the input data.
Current market price
Po – this can be subject to other short-terminfluences, such as rumoured takeover bids, which considerably distortthe estimate of the cost of equity.
Future dividends
For simplicity we usually assume no growth or constant growth.These are unlikely growth patterns. Further, growth estimates based onthe past are not always useful; market trends, economic conditions,inflation, etc. need to be considered. In examination questions futuredividends are often estimated rather mechanically but it is important tothink about influences on future dividends other than past dividends.
Relevance of earnings in the DVM
Earnings do not feature as such in the DVM. However, earningsshould be an indicator of the company's long-term ability to paydividends and therefore in estimating the rate of growth of futuredividends, the rate of growth of the underlying profits must also beconsidered. For example, if dividends grow at 10% whilst earnings growat 5%, before long the firm will run out of funds with which to paydividends. Similarly, if dividends grow at 5% and profits at 10%, thefirm will soon accumulate excess funds.

3 Estimating the cost of preference shares
Preference shares usually have a constant dividend. So the sameapproach can be used as we saw with estimating the cost of equity withno growth in dividends.
The formulae are therefore:
where:
D = the constant annual preference dividend
Po = ex div MV of the share
Kp = cost of the preference share.
 The fixed dividend is based on the nominal value of the preferenceshare, which may vary. Do not assume the nominal value is always $1.

 Test your understanding 10 – Cost of preference shares
A company has 50,000 8% preference shares in issue, nominal value $1. The current ex div MV is $1.20/share.
What is the cost of the preference shares?

4 Estimating the cost of debt
Types of debt
 Terminology
- The terms loan notes, bonds, loan stock and marketable debt, are used interchangeably. Gilts are debts issued by the government.
- Irredeemable debt – no repayment of principal – interest in perpetuity.
- Redeemable debt – interest paid until redemption of principal.
- Convertible debt – may be later converted to equity.
Key points to note
- Debt is always quoted in $100 nominal value blocks.
- Interest paid on debt is stated as a percentage of nominal value – called the coupon rate.
- The terms ex-interest and cum-interest are used in much the same way as ex-div and cum-div was for the cost of equity calculations

 The coupon rate
The coupon rate is fixed at the time of issue, in line with theprevailing market interest rate. An 8% coupon rate means that $8 ofinterest will be paid on $100 nominal value block of debt.
The market value (MV) of loan notes may change daily. The maininfluence on the price of a loan note is the general level of interestrates for debt at that level of risk and for the same period tomaturity.

Cost of debt and the impact of tax relief
A distinction must be made between the required return of debt holders / lenders (Kd) and the company's cost of debt (Kd(1-T)).Although in the context of equity the company's cost is equal to theinvestor's required return, the same is not true of debt. This isbecause of the impact of tax relief.

 The impact of tax relief
Consider two companies, identical apart from the choice of finance:A is all equity financed; B has $10,000 of 10% fixed interest debt.
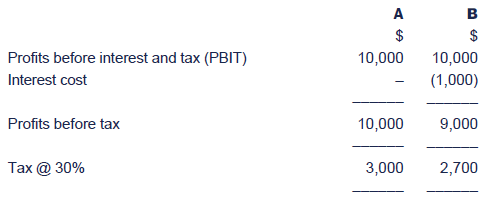
B has paid $300 less tax because of the tax deductibility of the debt interest.
Therefore the net cost of the debt interest to B is:

So B's actual cost of debt is 700/10,000 = 7%
i.e. I (1 – T)
where:
I = coupon rate
T = rate of corporation tax.

Consequently we will use separate terms to distinguish the two figures:
- 'Kd'– the required return of the debt holder (pre-tax)
- 'Kd (1 – T)' – the cost of the debt to the company (post-tax).
Care must be taken since it is not always possible to simply calculate 'Kd (1 – T)' by taking Kd and multiplying by (1 – T). You should therefore regard 'Kd (1 –T)' as a label for the post tax cost of debt rather than as a mathematical formula.
Note also that Kd, the required return of the debtholder can also be referred to as the 'yield', the 'return on debt' andas the 'pre-tax cost of debt'.
Irredeemable debt
The company does not intend to repay the principal but to pay interest forever.
Assumptions:

- expected income stream will be the interest paid in perpetuity.
The formula for valuing a loan note is therefore:
where:
I = annual interest starting in one year's time
MV = market price of the loan note now (year 0)
Kd = debt holders' required return (pre-tax cost of debt), expressed as a decimal.
The required return (pre-tax cost of debt) can be found by rearranging the formula:
The post-tax cost of debt to the company is found by adjusting the formula to take account of the tax relief on the interest:
where T = rate of corporation tax.
 TheMV of the loan notes is set by the investor, who does not get taxrelief, and is therefore based on the interest before tax. The companygets corporation tax relief so the cost of debt calculation for thecompany is based on interest after tax.

 Test your understanding 11 – Irredeemable debt
A company has in issue 10% irredeemable debt quoted at $80 ex interest. The corporation tax rate is 30%
(a)What is the return required by the debt providers (the pre-tax cost of debt)?
(b)What is the post-tax cost of debt to the company?


 Test your understanding 12 – Irredeemable debt
A company has irredeemable loan notes currently trading at $50 exinterest. The coupon rate is 8% and the rate of corporation tax is 30%.
(a)What is the return required by the debt providers (the pre-tax cost of debt)?
(b)What is the post-tax cost of debt to the company?

Redeemable debt
The company will pay interest for a number of years and then repaythe principal (sometimes at a premium or a discount to the original loanamount).
Assumptions:
- Market price = Future expected income stream from the loan notes discounted at the investor's required return (pre-tax cost of debt).
- expected income stream will be:
- interest paid to redemption
- the repayment of the principal.
 Hence the market value of redeemable loan notes is the sum of the PVs of the interest and the redemption payment.

 Illustration of redeemable debt
A company has in issue 12% redeemable loan notes with 5 years toredemption. Redemption will be at par. The investors require a return of10%. What is the MV of the loan notes?
Solution
The MV is calculated by finding the PVs of the interest and the principal and totalling them as shown below.
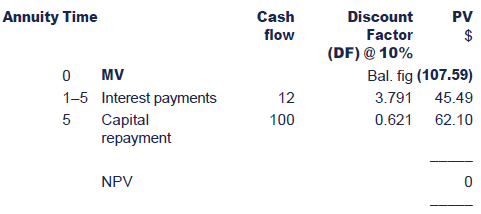
Note that for the investor the purchase is effectively a zero NPVproject, as the present value of the income they receive in the futureis exactly equivalent to the amount they invest today.
The investor's required return is therefore the internal rate ofreturn (IRR) (breakeven discount rate) for the investment in the loannotes.

 The return an investor requires can therefore be found by calculating the IRR of the investment flows:


 Test your understanding 13 – Redeemable debt
A company has in issue 12% redeemable debt with 5 years toredemption. Redemption is at par. The current market value of the debtis $107.59. The corporation tax rate is 30%.
What is the return required by the debt providers (pre-tax cost of debt)?

 If it is the post-tax cost of debt to the company that is required, anIRR is still calculated but as the interest payments are tax-deductible,the IRR calculation is based on the following cash flows:


 Test your understanding 14 – Redeemable debt
Using the same information as given in the previous TYU:
A company has in issue 12% redeemable debt with 5 years toredemption. Redemption is at par. The current market value of the debtis $107.59. The corporation tax rate is 30%.
What is the cost of debt to the company (post-tax cost of debt)?


 Additional question - Redeemable debt
A company has in issue 10% loan notes with a current MV of $98. The loan notes are due to be redeemed at par in five years time.
If corporation tax is 30%, what is the company's post-tax cost of debt?
The answer to this question can be found after the chapter summary diagram at the end of this chapter.

Debt redeemable at current market price
In this situation, where the debt is redeemable at its currentmarket price, the position of the investor is the same as a holder ofirredeemable debt.

 Debt redeemable at current market price illustration
Consider the following investments:
(a)an irredeemable loan note trading at $100 with a coupon rate of 5%
(b)a redeemable loan note trading at $100 with a coupon rate of 5%, due to be redeemed at $100 in 3 years.
The return required by an investor (pre-tax cost of debt) in (a) can be calculated as:

If the investor was instead to invest in (b), they would earn only 3 years of interest rather than receiving it in perpetuity.
The interest for 3 years (using the same required return of 5%) would have a PV of:
= 3yr AF @ 5% × $5
From our tables, we get:
= 2.723 × $5 = $13.60
The $100 received at T3 (at a required return of 5%) would have a present value of:
Therefore the PV of the overall return = $13.60 + $86.40= $100.
This is the same return as received by the investor in the irredeemable debt!

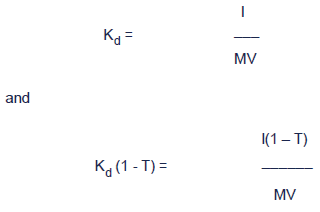
 Therefore where debt is redeemable at its current market price:
Convertible debt
 A form of loan note that allows the investor to choose between takingthe redemption proceeds or converting the loan note into a pre-setnumber of shares.
 To calculate the cost of convertible debt you should:
(1)Calculate the value of the conversion option using available data
(2)Compare the conversion option with the cash option. Assume all investors will choose the option with the higher value.
(3)Calculate the IRR of the flows as for redeemable debt
Note: the is no tax effect whichever option is chosen at the conversion date.

 Test your understanding 15 – Convertible debt
A company has issued convertible loan notes which are due to beredeemed at a 5% premium in five year's time. The coupon rate is 8% andthe current MV is $85. Alternatively, the investor can choose to converteach loan note into 20 shares in five year's time.
The company pays tax at 30% per anum.
The company's shares are currently worth $4 and their value is expected to grow at a rate of 7% pa.
Find the post-tax cost of the convertibledebt to the company.

Non-tradeable debt
Bank and other non-tradeable fixed interest loans simply need to be adjusted for tax relief:
 Cost to company = Interest rate × (1 – T).
Alternatively, the cost of any 'normal' traded company debt could be used instead

 Test your understanding 16 – Non-tradeable debt
A firm has a fixed rate bank loan of $1million. It is charged 11% pa. The corporation tax rate is 30%.
What is the post-tax cost of the loan?

5 Estimating the cost of capital
The need for a weighted average
In the analysis so far carried out, each source of finance has beenexamined in isolation. However, the practical business situation isthat there is a continuous raising of funds from various sources.
These funds are used, partly in existing operations and partly tofinance new projects. There is not normally any separation between fundsfrom different sources and their application to specific projects:
Even if a question tells you that a project is to be financed bythe raising of a particular loan or through an issue of shares, inpractice the funds raised will still be added to the firm's pool offunds and it is from that pool that the project will be funded.
 Itis therefore not the marginal cost of the additional finance, but theoverall average cost of all finance raised, that is required for projectappraisal.
 The general approach is to calculate the cost of each individual sourceof medium-long term finance and then weight it according to itsimportance in the financing mix.
This average is known as the weighted average cost of capital (WACC).

 Average and marginal cost of capital
A firm's average cost of capital (ACC) is the average cost of thefunds, normally represented by the WACC. The computed WACC representsthe cost of the capital currently employed. This represents financialdecisions taken in previous periods.
Alternatively, the cost of raising the next increment of capitalcan be determined – this is what is termed the marginal cost ofcapital (MCC). The firm's MCC is the additional cost the firm will payto raise an additional dollar of capital, assuming the capital is raisedusing the optimal capital proportions (see chapter on capitalstructure).
The relationship between MC and AC can be represented graphically, as indicated in the figure below.
The relationship between ACC and MCC curves can be explained asfollows: while the MCC is less than the ACC, the ACC will fall. Once theMCC rises above the ACC, however, the MCC will pull up the ACC, albeitat a slower rate than that at which MCC is rising.

Choice of weights
To find an average cost, the various sources of finance must be weighted according to the amount of each held by the company.
The weights for the sources of finance could be:
- book values (BVs) – represents historic cost of finance
- MVs – represent current opportunity cost of finance.
Wherever possible MVs should be used.

 Choice of weights
If we use the current proportions in which funds are raised, their weights may be measured by reference to BVs or MVs.
Note that when using BVs, reserves such as share premium andretained profits are included in the BV of equity, in addition to thenominal value of share capital.
However, the value of shareholders' equity shown in a set ofaccounts will often reflect historic asset values, and will not reflectthe future prospects of an organisation or the opportunity cost ofequity entrusted by shareholders. Consequently it is preferable to useMV weights for the equity. Note that when using MVs, reservessuch as share premium and retained profits are ignored as they are ineffect incorporated into the value of equity.
Equally, we should also use the MV rather than the BV of the debt,although the discrepancy between these is likely to be much smaller thanthe discrepancy between the MV and BVs of equity.

Calculating weights
When using market values to weight the sources of finance, you should use the following calculations:

Calculating the WACC
The calculation involves a series of steps.
Step 1 Calculate weights for each source of capital.
Step 2 Estimate cost of each source of capital.
Step 3 Multiply proportion of total of each source of capital by cost of that source of capital.
Step 4 Sum the results of Step 3 to give the WACC.
All of the above can be summarised in the following formula, which is provided for you in the exam.

where:
Ve and Vd are the market values of equity and debt respectively
Ke is the cost of equity
Kd (1 – T) is the post-tax cost of debt

 Test your understanding 17 – WACC
Butch Co has $1 million loan notes in issue, quoted at $50 per $100of nominal value; $625,000 preference shares of $1 each quoted at 40cand 5 million ordinary $1 shares quoted at 25c. The cost of capital ofthese securities is 9%, 12% and 18% respectively. This capital structureis to be maintained.
Calculate the weighted average cost of capital.


 Test your understanding 18 – WACC
B Co has 10 million 25c ordinary shares in issue with a currentprice of 155c cum div. An annual dividend of 9c has just been proposed.The company earns an accounting rate of return to equity (ROE) of 10%and pays out 40% of the return as dividends.
The company also has 13% redeemable loan notes with a nominal valueof $7 million, trading at $105. They are due to be redeemed at par infive year's time.
If the rate of corporation tax is 33%, what is the company's WACC?

When to use the weighted average cost of capital
The WACC calculation is based upon the firm's current costs ofequity and debt. It is therefore appropriate for use in investmentappraisal provided:
- the historic proportions of debt and equity are not to be changed
- the operating risk of the firm will not be changed
- the finance is not project-specific, i.e. projects are financed from a pool of funds.
or
- the project is small in relation to the company so any changes are insignificant.
If any of these criteria are not met it will not be appropriate to appraise a project using the historic WACC.
6 The impact of risk
The DVM and WACC calculations above assume that an investor'scurrent required return will remain unchanged for future projects. Forprojects with different risk profiles, this assumption may not holdtrue.
We therefore need a way to reflect any potential increase in risk in our estimate of the cost of finance.
When considering the return investors require, the trade-off withrisk is of fundamental importance. Risk refers not to the possibility oftotal loss, but to the likelihood of actual returns varying from thoseforecast.
Consider four investment opportunities: A, B, C and D shown on the risk/return chart below where:
The risk of project A = the risk of project B.
The return from B = the return from C.
In choosing between the investment opportunities:
B is preferable to A – higher return for the same risk
C is preferable to B – same return for lower risk.
NB. The choice between D and C is less clear-cut. C payshigher returns but this is to compensate for the comparatively higherassociated risk. The choice will therefore depend on the investor'sattitude to risk and whether the increased return is seen by them assufficient compensation for the higher level of risk.

 The impact of risk
The DVM discussed above, assumes that the return currently beingpaid to ordinary shareholders will continue to be their required returnin the future.
We have seen that the return required is a reflection of the risk the investor faces.
Therefore by using the DVM we are effectively assuming that allfuture investment projects will be subject to the same risk as thosecurrently undertaken.
However, if the company is considering an investment project in adifferent business area, these assumptions may not be appropriate and analternative approach to finding the cost of equity is needed.

We've already said that the total return demanded by an investor is actually dependent on two specific factors:
- the prevailing risk-free rate (Rf) of return
- the reward investors demand for the risk they take in advancing funds to the firm.
Let's look at each of these and how they relate to the different sources of finance.
The risk-free rate of return (Rf)
 The Rf is the minimum rate required by all investors for an investment whose returns are certain.
 It is given in questions as:
- the return on Treasury bills or
- the return on government gilts.

 The risk free rate of return
Once funds have been advanced to a company, an investor faces therisk that they will not be returned. However some investments are lessrisky than others. For example lending to a government is considered tobe extremely low risk as governments are always able to raise funds viataxation to pay back the investor.
The risk is so minimal that government securities are known asrisk-free and the return they pay is a minimum benchmark against whichall other investments can be measured.
The return is sometimes given in examination questions as the return on Treasury Bills or gilts (gilt-edged securities).
Note that the Rf does include compensation for inflation – i.e. it is a nominal or money rate.

Return on risky investments – loan notes
A risk-free investment has a certain return. Although notrisk-free, loan notes are lower risk investments than equities becausethe return is more predictable. This is because:
- interest is a legal commitment
- interest will be paid before any dividends
- loans are often secured.
If a company issues loan notes, the returns needed to attract investors will therefore be:
- higher than the Rf
- lower than the return on equities.

 Return on loan notes
As companies have to make profits in order to honour their loancommitments, loan notes or corporate bonds are not risk-free. Since theyare risky investments the company will need to offer a higherreturn/yield than is paid on gilts to entice investors. The investorswill require both a risk-free return and a risk premium.
However as we saw in chapter 15 loan notes are a relativelylow-risk investment. Since the loan commitments are legally binding andoften secured on company assets they are considered to be less riskythan equity investments.
Not all bonds have the same risk. There is a bond-rating system,which helps investors distinguish a company's credit risk. Below is theFitch and Standard & Poor's bond-rating scales.
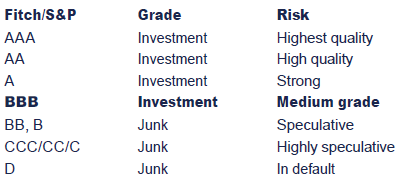
Notice that if the company falls below a certain credit rating, itsgrade changes from investment quality to junk status. Junk bonds areaptly named: they are the debt of companies in some sort of financialdifficulty. Because they are so risky they have to offer much higheryields than other debt. This brings up an important point: not all bondsare inherently safer than shares.
The minimum investment grade rating is BBB. Institutional investorsmay not like such a low rating. Indeed some will not invest below an Arating.

Return on risky investments – equities
Equity shareholders are paid only after all other commitments havebeen met. They are the last investors to be paid out of company profits.
The same pattern of payment also occurs on the winding up of a company. The order of priority is:
- secured lenders
- legally-protected creditors such as tax authorities
- unsecured creditors
- preference shareholders
- ordinary shareholders.
As their earnings also fluctuate, equity shareholders thereforeface the greatest risk of all investors. Since ordinary shares are themost risky investments the company offer, they are also the mostexpensive form of finance for the company.
The level of risk faced by the equity investor depends on:
- volatility of company earnings
- extent of other binding financial commitments.
Given the link to the volatility of company earnings, it is theseinvestors that will face more risk if the company was to embark onriskier projects.
If we want to assess the impact of any potential increase (ordecrease) in risk on our estimate of the cost of finance, we must focuson the impact on the cost of equity.
The return required by equity investors can be shown as

 Equities
Equity shareholders are the last investors to be paid out ofcompany profits or in the event of a winding up. The level of risk theyface will depend on how volatile the company's earnings are to startwith and how great its other commitments are (e.g. how much debt financeis to be serviced – see chapter on capital structure).
After contractual commitments such as debt interest, the profitsavailable for distribution are then used to pay any preferenceshareholders, before the ordinary shareholders are finally able toparticipate in any remaining surplus.
What's more, dividends are paid only on the recommendation of thedirectors, and they may decide, if the business has not had a good year,to pay a reduced dividend or even to withhold a dividend altogether.

7 Estimating the cost of equity – the Capital Asset Pricing Model (CAPM)
If an investor's required return reflects the risk they face, thenone method of calculating the cost of equity involves looking moreclosely at the nature of the risk itself.
Reducing risk by combining investments
An investor, knowing that a particular investment was risky, coulddecide to reduce the overall risk faced, by acquiring a second sharewith a different risk profile and so obtain a smoother average return.
 Reducing the risk in this way is known as diversification.
The diagram above is an exaggeration, as the returns from no two investments will ever move in completely opposite directions.
However an investor can reduce risk by diversifying to hold aportfolio of shareholdings, since shares in different industries will atleast to some degree offer differing returns profiles over time.
Provided the returns on the shares are not perfectly positivelycorrelated (that is they do not move in exactly the same way) then anyadditional investment brought into a portfolio (subject to a maximumpoint – see below) will reduce the overall risk faced.

 Reducing risk by combining investments
In the diagram above, the investor has combined investment A (forexample shares in a company making sunglasses) with investment B,(perhaps shares in a company making raincoats). The fortunes of bothfirms are affected by the weather, but whilst A benefits from thesunshine, B loses out and vice versa for the rain. Our investor hastherefore smoother overall returns – i.e. faces less overallvolatility/risk and will need a lower overall return.
The returns from the investments shown are negatively correlated– that is they move in opposite directions. In fact they appear tohave close to perfect negative correlation – any increase in one isalmost exactly matched by a decrease the other.
The diagram above is an exaggeration, as it is unlikely that thereturns of any two businesses would move in such opposing directions,but the principle of an investor diversifying a portfolio of holdings toreduce the risk faced is a good one.
However an investor can reduce risk by diversifying to hold aportfolio of shareholdings, since shares in different industries will atleast to some degree offer differing returns profiles over time.
Provided the returns on the shares are not perfectly positivelycorrelated (that is they do not move in exactly the same way) then anyadditional investment brought into a portfolio (subject to a maximumpoint – see below) will reduce the overall risk faced.

Initial diversification will bring about substantial risk reduction as additional investments are added to the portfolio.
 However risk reduction slows and eventually stops altogether once 15-20 carefully selected investments have been combined.
This is because the total risk faced is not all of the same type.
Systematic and non-systematic risk
 The risk a shareholder faces is in large part due to the volatility ofthe company's earnings. This volatility can occur because of:
- systematic risk – market wide factors such as the state of the economy
- non-systematic risk – company/industry specific factors.
Systematic risk will affect all companies in the same way (althoughto varying degrees). Non-systematic risk factors will impact each firmdifferently, depending on their circumstances.
Diversification can almost eliminate unsystematic risk, but sinceall investments are affected in the same way by macro-economic i.e.systematic factors, the systematic risk of the portfolio remains.

 Test your understanding 19 – Systematic and non systematic risk
The following factors have impacted the volatility of the earningsof Chocbic Co, a manufacturer of chocolate biscuits and cereals:
- increase in interest rates
- increase in the price of cocoa beans
- legislation changing the rules on tax relief for investments in non-current assets
- growth in the economy of the country where Chocbic Co is based
- government advice on the importance of eating breakfast
- industrial unrest in Chocbic Co's main factory.
Are they examples of systematic or unsystematic risk?

Investors and systematic risk
Rational risk-averse investors would wish to reduce the risk they faced to a minimum and would therefore:
- arrange their portfolios to maximise risk reduction by holding at least 15-20 different investments
- effectively eliminate any unsystematic risk
- only need to be compensated for the remaining systematic risk they faced.
The CAPM
The CAPM shows how the minimum required return on a quoted security depends on its risk.
The required return of a rational risk-averse well-diversified investor can be found by returning to our original argument:
This can be further expanded as:
So the formula becomes:
E(r)j = Rf + β (Rm –Rf)
where:
E(r)j = required return
Rf = risk-free rate
Rm = average return on the market
(Rm – Rf) = equity risk premium (sometimes referred to as average market risk premium)
β = systematic risk of the investment compared to market and therefore amount of the premium needed.
The formula is that of a straight line, y = a + bx, with β as the independent variable, Rf as the intercept with the y-axis, (Rm – Rf) as the slop of the line, and E(r)j(the required return) as the values being plotted on the straight line.The line itself is called the security market line (SML) and can bedrawn as:
Understanding beta:
If an investment is riskier than average (i.e. the returns more volatile than the average market returns) then the β > 1.
If an investment is less risky than average (i.e. the returns less volatile than the average market returns) then the β <>
If an investment is risk free then β = 0.

 The CAPM
A security whose returns are highly correlated with fluctuations inthe market is said to have a high level of systematic risk. It does nothave much risk-reducing potential on the investor's portfolio andtherefore a high return is expected of it. On the other hand, a securitywhich has a low correlation with the market (low systematic risk) isvaluable as a risk reducer and hence its required return will be lower.
The measure of the systematic risk of a security relative to thatof the market portfolio is referred to as its beta factor. In practiceindustries such as construction are far more volatile than others suchas food retailing and would have correspondingly higher betas.
The CAPM shows the linear relationship between the risk premium of the security and the risk premium of the market portfolio.
Risk premium of share = market risk premium × β
i.e. Required return of share = Rf + market risk premium × β
or Rj = Rf + (Rm –Rf)β
The same formula can be applied to computing the minimum requiredreturn of a capital investment project carried out by a company, becausethe company is just a vehicle for the shareholders, who will view theproject as an addition to the market portfolio.
The formula sheet expresses this as
E(ri) = Rf + βi(E(rm) – Rf)
if an investment is risk free then β = 0
In order to use the CAPM, investors need to have values for the variables contained in the model.
The risk free rate of return
In the real world, there is no such thing as a risk-free asset.Short-term government debt (e.g. Treasury bills) is a relatively safeinvestment and in practice, is used as an acceptable substitute for therisk-free asset.
The market risk premium
Often referred to as the equity risk premium, this is thedifference between the average return on the capital market and therisk-free rate of return. It represents the extra return required forinvesting in equity rather than investing in risk-free assets.
In the short-term, share prices can fall as well as increase,leading to a negative average return. To smooth out such short-termchanges, a time-smoothed moving average analysis can be carried out overlonger periods of time, often several decades.
Beta
Beta values are found using regression analysis to compare thereturns on a share with the returns on the capital market. The betavalue for UK companies traded on the UK capital market can be readilyfound on the internet.


 Test your understanding 20 – The CAPM
The current average market return being paid on risky investmentsis 12%, compared with 5% on Treasury bills. G Co has a beta of 1.2. Whatis the required return of an equity investor in G Co?


 Test your understanding 21 – The CAPM
B Co is currently paying a return of 9% on equity investment. Ifthe return on gilts is currently 5.5% and the average return on themarket is 10.5%, what is the beta of B Co and what does this tell usabout the volatility of B's returns compared to those of the market onaverage?

 The CAPM is based on a number of assumptions:
- well-diversified investors
- perfect capital market
- unrestricted borrowing or lending at the risk-free rate of interest
- all forecasts are made in the context of a single period transaction horizon.
It is important to be aware of these assumptions and the reasons why they can be criticised.

 Assumptions underpinning CAPM
Investors hold diversified portfolios
From the assumptions of CAPM it is deduced that all investors willhold a well-diversified portfolio of shares, known as the marketportfolio, which is really a 'slice' of the whole stock market.
This assumption means that investors will only require a return forthe systematic risk of their portfolios, since the unsystematic riskhas been removed.
Although the market portfolio is not really held by investors, inpractice even a limited diversification will produce a portfolio whichapproximates its behaviour, so it is a workable assumption.
Perfect capital market
This assumption means that all securities are valued correctly and that their returns will plot on to the SML.
A perfect capital market requires:
- no taxes,
- no transaction costs,
- perfect information that is freely available to all investors,
- all investors to be risk averse and rational, and
- a large number of buyers and sellers in the market.
Real-world capital markets are clearly not perfect.
Unrestricted borrowing or lending at the risk-free rate of interest
This assumption provides a minimum level of return required byinvestors. In reality, this is not possible because the risk associatedwith individual investors is much higher than that associated with theGovernment. This inability to borrow at the risk-free rate means theslope of the SML is shallower in practice than in theory.
Single-period transaction horizon
A holding period of one year is usually used in order to makecomparable the returns on different securities. A return over sixmonths, for example, cannot be compared to a return over 12. Thisassumption appears reasonable because even though many investors holdsecurities for much longer than one year, returns on securities areusually quoted on an annual basis.

Using CAPM in project appraisal
This CAPM formula can be used to calculate a risk adjusted cost ofequity for use in situations where the risk associated with the projectbeing appraised is different from the usual operating risk of thecompany.
To do this, it is necessary to estimate the beta factor of the newinvestment project. This is most commonly done by examining the betas ofquoted companies in a similar line of business to the new project;these companies are referred to as 'proxy companies', and their betas as'proxy betas'.
It is important to understand that the CAPM equation only gives usthe required return of the shareholders. If the project is to be equityfinanced, this can be used as the project discount rate. If the projectis to be financed with both debt and equity, then the shareholders'required return will need to be combined with the cost of debt to findan appropriate discount rate.
The advantages and disadvantages of CAPM
Advantages:
- works well in practice
- focuses on systematic risk
- is useful for appraising specific projects.
Disadvantages:
- less useful if investors are undiversified
- ignores tax situation of investors
- actual data inputs are estimates and may be hard to obtain.

 Advantages and disadvantages of CAPM
In practice, many of the assumptions underlying the development ofCAPM are violated. However, rather than being overly critical, it ismore sensible to ask 'does the theory work?', i.e. does it explain thereturns on securities in the real world?
Fortunately, the answer is yes. Practical empirical tests, whilstshowing that betas are not perfect predictors of rates of returns oninvestments, do show a strong correspondence between systematic risk andrate of return. Certainly CAPM outperforms other models in this area,and in particular it gives a far better explanation of the rate ofreturn on a security than is obtained by looking at its total risk.
Advantages of CAPM
- It provides a market-based relationship between risk and return, and assessment of security risk and rates of return given that risk.
- It shows why only systematic risk is important in this relationship.
- It is one of the best methods of estimating a quoted company's cost of equity capital.
- It provides a basis for establishing risk-adjusted discount rates for capital investment projects.
Limitations of CAPM
By concentrating only on systematic risk, other aspects of risk areexcluded; these unsystematic elements of risk will be of majorimportance to those shareholders who do not hold well-diversifiedportfolios, as well as being of importance to managers and employees.Hence it takes an investor-orientated view of risk.
The model considers only the level of return as being important toinvestors and not the way in which that return is received. Hence,dividends and capital gains are deemed equally desirable. Withdifferential tax rates the 'packaging' of return between dividends andcapital gain may be important.
It is strictly a one-period model and should be used with caution,if at all, in the appraisal of multi-period projects. Some of therequired data inputs are extremely difficult to obtain or estimate, forexample:
Rf can be obtained from quoted rates. From the widerange of quoted interest rates, a relevant rate must be decided on.Ideally, the rate ought to relate to a security with the same durationas the project being appraised.
Beta – the measure of systematic risk. Here an estimate isusually required. Such estimates may be derived from subjectivejudgement, sensitivity analysis or, in some cases, by analysing (and,where necessary, adjusting) the beta coefficient of quoted firms whichare thought to display the same risk characteristics as the projectbeing appraised (see chapter on capital structure). Use of regressionanalysis is subject to statistical error, the presence of unsystematicrisk, and the effects of not having a perfect investment market –security prices not always simply reflecting underlying risk.
Rm is extremely difficult to determine as the market isvolatile and the expected return is likely to vary with changes in theRf. Hence, users often attempt to estimate (Rm – Rf), the equity riskpremium or excess return on the market. Historically in the UK thisexcess return has varied between 3% and 9% and similar figures may beused if:
(i)it is felt that historic data is likely to be a good estimate of the future
(ii) the expected excess return is thought to be a constant arithmetic amount above the Rf.
In practice there are certain instances when it is found that theCAPM does not perform as expected, e.g. investments with low betas,investments with low price/earnings (PE) ratios, investments with astrong seasonality.
Generally the basic CAPM is seen to overstate the required returnfor higher beta securities and understate the required return for lowbeta securities. However this problem mostly disappears when the effectsof taxation are introduced to develop the basic model.
Similarly, CAPM does not seem to generate accurate forecasts forreturns for companies with low price earnings ratios and is unable toaccount for seasonal factors observed in the UK stock market over theyears.
January appears nearly always to be an outstandingly successfulmonth for investing in UK shares, but no one can explain why this is thecase.

Chapter summary

 Answer to additional question - Redeemable debt
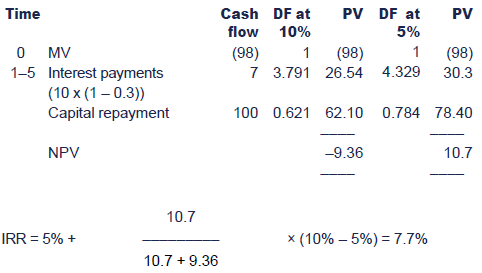
Therefore the company's cost of debt, Kd (1 – T), is 7.7%.

Test your understanding answers

 Test your understanding 1 – DVM no growth
30 ÷ 150 = 20%.


 Test your understanding 2 – DVM with growth


 Test your understanding 3 – DVM with growth


 Test your understanding 4 – The ex-div share price
140 – 8 = 132c.


 Test your understanding 5 – The ex div share price
Since a dividend is about to be paid, the share price given must be cum div. The ex div price is therefore:
125 – 15 = 110c


 Test your understanding 6 – Using past dividends
Since growth is assumed to be constant, the growth rate, g, can beassumed to have been the same in each of the 5 years, i.e. the 20c willhave become 32c after 5 years of constant growth.

Therefore 1 + g = 1.6 1/ 5 ≈ 1.1, so g = 0.1 or 10%


 Test your understanding 7 – Using past dividends
dividend with four years growth

The growth rate, g, is therefore:

This is also known as the geometric growth rate.


 Test your understanding 8 – The earnings retention model
Profit after tax as a % of capital employed will be 20 ÷ 200 = 10%.
10% × asset value at 31 December 20X6 = 10% × $212 = $21.20.
Dividends will therefore be 40% × $21.20 = $8.48.
This represents a growth of 6% on the year (8.48/8 = 1.06).
This is more directly calculated as:
Note: that the return on equity is calculated with reference to opening statement of financial position values.
g = r (accounting rate of return) × b (the earnings retention rate)
= 10% × 60%
= 6%.


 Test your understanding 9 – The earnings retention model
where:
Po ex div = 200 – 16 = 184
Do = 16
b = 1 – dividend payout % = 1 – 0.2 = 0.8
g = r × b = 0.125 × 0.8 = 0.1


 Test your understanding 10 – Cost of preference shares


 Test your understanding 11 – Irredeemable debt
(a)Pre-tax cost of debt

(b)Post-tax cost of debt
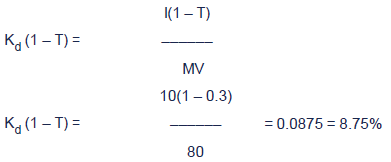
Note - this since this is irredeemable debt, a short-cut could be taken by multiplying the pre-tax cost of debt by (1 – T)
Kd (1 – T) = 12.5% (1 – 0.3) = 8.75%


 Test your understanding 12 – Irredeemable debt
(a)Pre-tax cost of debt
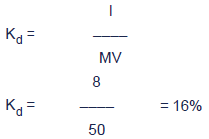
(b)Post-tax cost of debt
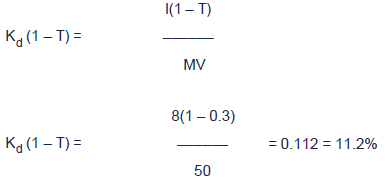
Note - this since this is irredeemable debt, a short-cut could be taken by multiplying the pre-tax cost of debt by (1 – T)
Kd (1 – T) = 16% (1 – 0.3) = 11.2%


 Test your understanding 13 – Redeemable debt
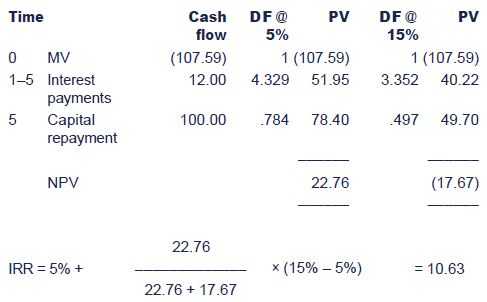
Therefore the required return of investors is 10.63%.
As the linear interpolation method used to estimate the IRR is anapproximation, it does not reconcile back to the 10% required return perthe illustration above.
Note: that the rate of corporation tax has been ignored, asthe question asked for the return required by the debt holders (pre-taxcost of debt) rather than the post-tax cost of debt to the company.


 Test your understanding 14 – Redeemable debt
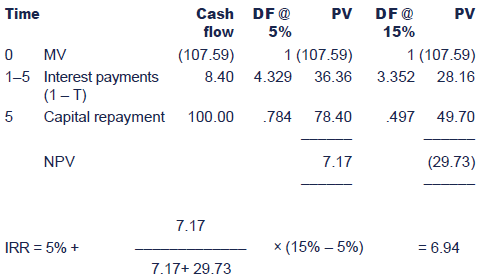
Therefore the required return of investors is 6.94%.


 Test your understanding 15 – Convertible debt
(1)Compare the redemption value (RV) with the value of the conversion option:
Cash RV = $100 × 1.05 = 105
Conversion value = 20 × 4(1.07)5 = 20 × 5.61 = 112.20
(2)Select the highest of the two values as the amount to be received at Tn.
It is assumed that the investors will choose to convert the debenture and will therefore receive $112.20. In an exam question, you must assess whether conversion is likely to occur
(3)Find the IRR of the cash flows to get the cost of debt as normal


 Test your understanding 16 – Non-tradeable debt
11 × 0.7 = 7.7%.


 Test your understanding 17 – WACC
S = step
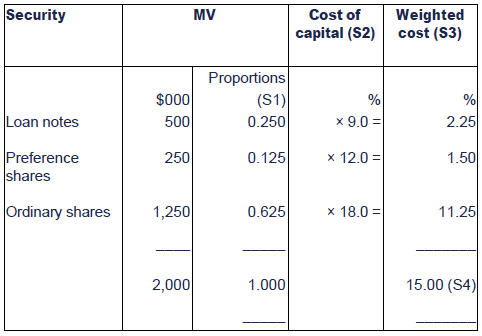
The weighted average cost of capital is therefore 15%. This figurerepresents an approximate cut-off rate of return on new investments.
Note that the relative costs of the various forms of financereflect the risk to investors: Debt is cheapest at 9% because it is lessrisky for the investor and attracts tax relief for the company.Preference shares carry a risk and hence a return that is between thatof debt and equity. The 18% return to the ordinary shareholders reflectsthe fact that their equity is most risky.


 Test your understanding 18 – WACC
Information for step 1
MV of equity
10m × ($1.55 – $0.09) = $14.6m
MV of debt
Trading at $105 therefore $7m ÷ 100 × 105 = $7.35m
Total MV of all finance = $14.6m + $7.35m = $21.95m
Step 2

Do = 9
Po = 155 – 9 = 146
g = r × b where r = 0.1 and b = (1 – 0.4)
g = 0.1 × 0.6 = 0.06

Cost of debt is found using an IRR calculation:


Note: If calculating cost of capital in the examination, do areasonableness check to ensure that the cost of debt is less than thecost of equity.


 Test your understanding 19 – Systematic and non systematic risk
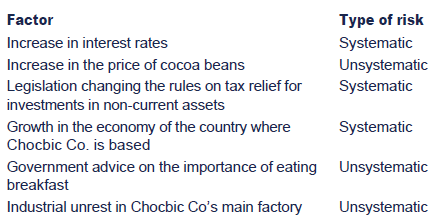


 Test your understanding 20 – The CAPM
Solution
Required return = Rf + β (Rm – Rf)
re = 5 + 1.2 (12 – 5) = 13.4%.


 Test your understanding 21 – The CAPM
Required return = Rf + β (Rm – Rf)
9% = 5.5% + β (10.5 – 5.5)
3.5% = 5 β
β = 3.5/5 = 0.7
Since the beta is <1 the="" returns="" are="" less="" volatile="" than="">

|
Created at 5/24/2012 4:18 PM by System Account
(GMT) Greenwich Mean Time : Dublin, Edinburgh, Lisbon, London
|
Last modified at 5/25/2012 12:54 PM by System Account
(GMT) Greenwich Mean Time : Dublin, Edinburgh, Lisbon, London
|
|
|
|
 |
Rating
:
|
 Ratings & Comments
(Click the stars to rate the page) Ratings & Comments
(Click the stars to rate the page)
|
 |
Tags:
|
|
|
|
|