Chapter 2: Cost volume profit analysis
Chapter learning objectives
Upon completion of this chapter you will be able to:
- explain the nature of CVP analysis
- calculate and interpret break even point and margin of safety
- calculate the contribution to sales ratio, in single and multi-product situations, and demonstrate an understanding of its use
- calculate target profit or revenue in single and multi-product situations, and demonstrate an understanding of its use
- prepare break even charts and profit volume charts and interpret the information contained within each, including multi-product situations
- discuss the limitations of CVP analysis for planning and decision making.
1 Break-even analysis
Also known as CVP analysis, or cost-volume-profit analysis.Break-even analysis is the study of the effects on future profit ofchanges in fixed cost, variable cost, sales price, quantity and mix.
CVP analysis is a particular example of ‘what if?'analysis. A business sets a budget based upon various assumptions aboutrevenues, costs, product mixes and overall volumes. CVP analysisconsiders the impact on the budgeted profit of changes in these variousfactors.
2 Single product break-even analysis
Examples will be used to illustrate the basic formulae and calculations.

 Test your understanding 1 - Break-even analysis
The following data relate to Product PQ:

Fixed costs are £50,000.
(a) Calculate the number of units that must be made and sold in order to break even.
(b) Calculate the level of activity that is required to generate a profit of £40,000.
(c) The company budgets to sell 13,000 units of Product PQ.
Calculate the margin of safety.
The margin of safety is the difference between the budgeted levelof activity and the break-even level of activity. It may be expressedin terms of units, sales value or as a percentage of the originalbudget.
(d)Calculate the Contribution/Sales ratio for Product PQ.
The C/S ratio is normally expressed as a percentage. It isconstant at all levels of activity. The C/S ratio reveals the amount ofcontribution that is earned for every £1 worth of sales revenue.

(e)Calculate the break-even point again, this time expressed in terms of sales revenue.
(f)Calculate the sales revenue that is required to generate a profit of £40,000.

3 Drawing a Basic Breakeven Chart
A basic breakeven chart records costs and revenues on the verticalaxis (y) and the level of activity on the horizontal axis (x). Lines aredrawn on the chart to represent costs and sales revenue. The breakevenpoint can be read off where the sales revenue line cuts the total costline. We will use a basic example to demonstrate how to draw a breakevenchart. The data is:
The completed graph is shown below:

- Step 1. Select appropriate scales for the axes and draw and label them. Your graph should fill as much of the page as possible. This will make it clearer and easier to read. You can make sure that you do this by putting the extremes of the axes right at the end of the available space.
The furthest point on the vertical axis will be the monthly sales revenue, that is,
1,700 units × $50 = $ 85,000
The furthest point on the horizontal axis will be monthly sales volume of 1,700 units.
Make sure that you do not need to read data for volumes higher than 1,700 units before you set these extremes for your scales.
- Step 2. Draw the fixed cost line and label it. This will be a straight line parallel to the horizontal axis at the $20,000 level.
The $20,000 fixed costs are incurred in the short term even with zero activity.
- Step 3. Draw the total cost line and label it. The best way to do this is to calculate the total costs for the maximum sales level, which is 1,700 units in our example. Mark this point on the graph and join it to the cost incurred at zero activity, that is, $20,000.
- Step 4. Draw the revenue line and label it. Once again, the best way is to plot the extreme points. The revenue at maximum activity in our example is 1,700 × $50 = $85,000. This point can be joined to the origin, since at zero activity there will be no sales revenue.
- Step 5. Mark any required information on the chart and read off solutions as required. You can check that your chart is accurate by reading off the breakeven point and then check this against the calculation for breakeven:

The margin of safety can be seen as the area to the right of the breakeven point up to the forecast sales level of 1,700.
The contribution breakeven chart
One of the problems with the conventional or basic breakeven chartis that it is not possible to read contribution directly from the chart.A contribution breakeven chart is based on the same principles but itshows the variable cost line instead of the fixed cost line. The samelines for total cost and sales revenue are shown so the breakeven pointand profit can be read off in the same way as with a conventional chart.However, it is also possible also to read the contribution for anylevel of activity.
Using the same basic example as for the conventional chart, thetotal variable cost for an output of 1,700 units is 1,700 x $30 =$51,000. This point can be joined to the origin since the variable costis nil at zero activity.
The contribution can be read as the difference between the sales revenue line and the variable cost line.
This form of presentation might be used when it is desirable tohighlight the importance of contribution and to focus attention on thevariable costs.
Ensure you are familiar with these charts and that you are able to identify all the component parts.
4 The Profit–Volume Chart
Another form of breakeven chart is the profit–volume chart. Thischart plots a single line depicting the profit or loss at each level ofactivity. The breakeven point is where this line cuts the horizontalaxis. A profit–volume graph for our example is shown below.
The vertical axis shows profits and losses and the horizontal axis is drawn at zero profit or loss.
At zero activity the loss is equal to $20,000, that is, the amountof fixed costs. The second point used to draw the line could be thecalculated breakeven point or the calculated profit for sales of 1,700units.
The profit–volume graph is also called a profit graph or a contribution–volume graph.
The main advantage of the profit–volume chart is that it iscapable of depicting clearly the effect on profit and breakeven point ofany changes in the variables.

 Test your understanding 2 - RS
A company manufactures Product RS. The following data are available:
Selling price: $100 per unit
Variable cost: $60 per unit.
Fixed costs are $250,000. The company budgets to produce 12,000 units in the next period.
Required:
(a) Scenario I – Calculate:
(i)The break-even point (expressed in units and $ of revenue).
(ii) The level of activity required to generate a profit of $90,000 (expressed in units).
(iii)The margin of safety as a percentage.
(b) Using graph paper, draw a profit-volume chart for scenario I.
(c) Scenario II – Using the graph drawn in(b), illustrate and explain the impact of a change in Selling Price to$120 per unit, on:
(i)The break-even point (expressed in units and $ of revenue);
(ii) The level of activity required to generate a profit of $90,000 (expressed in units);
(iii)The margin of safety.


 Test your understanding 3 - Single product
R Company provides a single service to its customers. An analysisof its budget for the year ending 31 December 20X5 shows that, in Period3, when the budgeted activity was 6,570 service units with a salesvalue of $72 each, the margin of safety was 21.015%.
The budgeted contribution to sales ratio of the service is 35%.
Required:
Calculate the budgeted fixed costs in period 3.

5 Multi-Product Break-Even Analysis
The basic breakeven model can be used satisfactorily for a businessoperation with only one product. However, most companies sell a rangeof different products, and the model has to be adapted when one isconsidering a business operation with several products.
CVP Analysis assumes that, if a range of products is sold, sales will be in accordance with a pre-determined sales mix.
When a pre-determined sales mix is used, it can be depicted in theCVP Analysis by assuming average revenues and average variable costs forthe given sales mix.
However, the assumption has to be made that the sales mix remains constant.This is defined as the relative proportion of each product's sale tototal sales. It could be expressed as a ratio such as 2:3:5, or as apercentage as 20%, 30%, 50%.
The calculation of breakeven point in a multi-product firm followsthe same pattern as in a single product firm. While the numerator willbe the same fixed costs, the denominator now will be the weighted average contribution margin.
In multi-product situations, a weighted average C/S ratio is calculated by using the formula :

The Weighted Average C/S ratio is useful in its own right, as ittells us what percentage each $ of sales revenue contributes towardsfixed costs; it is also invaluable in helping us to quickly calculatethe breakeven point in sales revenue :


 Weighted Average Contribution to Sales ratio
Company A produces Product X and Product Y. Fixed overhead costsamount to $200,000 every year. The following budgeted information isavailable for both products for next year :

In order to calculate the breakeven revenue for the next year,using the budgeted sales mix, we need the weighted Average C/S ratio asfollows :


The breakeven revenue can now be calculated this way for company A :
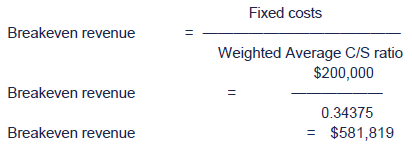
Calculations in the illustration above provide only estimatedinformation because they assume that products X and Y are sold in aconstant mix of 2X to 1Y. In reality, this constant mix is unlikely toexist and, at times, more Y may be sold than X. Such changes in the mixthroughout a period, even if the overall mix for the period is 2:1, willlead to the actual breakeven point being different than anticipated.

6 Establishing a Target Profit For Multiple Products
The approach is the same as in single product situations, but theweighted average contribution to Sales Ratio is now used so that :


 Target Profit in Company A
To achieve a target profit of $300,000 in Company A :


7 Margin of Safety Calculations
The basic breakeven model for calculating the margin of safety canbe adapted to multi-product environments. Three alternative approachesare considered in the example below.

 Illustration
A business operation produces three products, the X, the Y and the Z. Relevant details are:

Fixed costs are £2,000 per period, not attributable to individual products. A budget for the forecast is as follows:
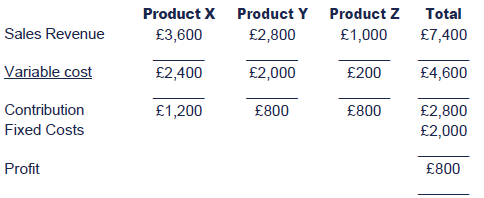
To calculate the margin of safety, three approaches are possible :
(1) Consider the products in sequence, X then Y then Z. In thiscase, it can be seen that breakeven occurs at 800 units of sales (400Xplus 400Y) and the margin of safety is 200 units of Z.
(2) Consider output in terms of £ sales and assume a constantproduct mix (2X:2Y:1Z). Inspection of the budget (above) shows that £1sales is associated with £0.6216 variable costs (that is, £4,600variable costs ÷ £7,400 sales). The contribution per £1 sales is£0.3784 (i.e. £1 - £0.6216). So, if the fixed costs are £2,000 thenthe breakeven point is £5,285 sales and the margin of safety is £2,115 (i.e. £7,400 forecast sales - £5,285).
(3) Consider output in terms of percentage of forecast sales and aconstant product mix. Inspection of the budget shows that 1 per cent offorecast sales is associated with a contribution of £28.00 (i.e.£2,800 total contribution ÷ 100 per cent). So, if fixed costs are£2,000 it follows that the breakeven point is 71.43 per cent and the margin of safety is 28.57 per cent.

8 The Multi-Product Profit-Volume Graph - Step-By-Step
In a multi-product environment, two lines must be shown on theprofit-volume graph: one straight line, where a constant mix between theproducts is assumed; and one bow shaped line, where it is assumed thatthe company sells its most profitable product first and then its nextmost profitable product and so on.
STEP 1 : Calculate the C/S ratio of each product being sold, and rank the products in order of profitability.
STEP 2 : Draw the graph, showing cumulative sales on thex-axis. For example, if we assume 3 products X, Y and Z, then thefollowing graph could be drawn , with ‘V' representing the totalsales. At an output of 0, the profit earned will amount to the company'sfixed costs, represented by point k on the chart.
STEP 3 : Draw the line km, that represents the profitearned by product X – the slope of the line is determined by thecontribution per unit earned on sales of that product.
STEP 4 : Draw the line mn, that represents the profit earned by product y, which has a lower contribution per unit than product X. The line nj is the profit earned by the least profitable product, product Z.
STEP 5 : Draw the line joining points k and j :it reflects the average profitability of the three products, and eachpoint on that line represents the profit earned for the associatedoutput, assuming that the three products are sold in the standardproduct mix, i.e. the mix implied in the construction of the chart.Accordingly, the indicated breakeven point only applies if the productsare sold in the standard product mix.
It can also be seen that breakeven can also occur at lower levelsof output, provided the proportions of the products are changed. Forexample, the point B where the line kmnj crosses the horizontal axis indicates a possible breakeven point.

 Test your understanding 4 - Multi-product
BJS Ltd produces and sells the following three products:

The company expects the fixed costs to be £450,000 for the comingyear. Assume that sales arise throughout the year in a constant mix.
Required:
(a) Calculate the weighted average C/S ratio for the products.
(b) Calculate the break-even sales revenue required.
(c) Calculate the amount of sales revenue required to generate a profit of £600,000.
(d) Draw a multi-product profit-volume chart assuming the budget is achieved.
Formula for the break-even point in a multi-product environment (expressed as sales revenue required):

Formula to achieve a specified profit in a multi-product environment (expressed as sales revenue required):


9 Limitations of break-even analysis
Cost behaviour is affected by the interplay of a number of factors.Physical volume is only one of these factors; others include unitprices of input, efficiency, changes in production technology, wars,strikes, legislation, and so forth. Any CVP analysis is based onassumptions about the behaviour of revenue, costs and volume. A changein expected behaviour will alter the break-even point; in other words,profits are affected by changes in other factors besides volume. A CVPchart must be interpreted in the light of the limitations imposed by itsunderlying assumptions. The real benefit of preparing CVP charts is inthe enrichment of understanding of the interrelationships of all factorsaffecting profits, especially cost behaviour patterns over ranges ofvolume.
The following underlying assumptions will limit the precision and reliability of a given cost-volume-profit analysis.
(1) The behaviour of total cost and total revenue has been reliably determined and is linear over the relevant range.
(2) All costs can be divided into fixed and variable elements.
(3) Total fixed costs remain constant over the relevant volume range of the CVP analysis.
(4) Total variable costs are directly proportional to volume over the relevant range.
(5) Selling prices are to be unchanged.
(6) Prices of the factors of production are to be unchanged (for example, material, prices, wage rates).
(7) Efficiency and productivity are to be unchanged.
(8) The analysis either covers a single product or assumes that a given sales mix will be maintained as total volume changes.
(9) Revenue and costs are being compared on asingle activity basis (for example, units produced and sold or salesvalue of production).
(10)Perhaps the most basic assumption of all isthat volume is the only relevant factor affecting cost. Of course,other factors also affect costs and sales. Ordinary cost-volume-profitanalysis is a crude oversimplification when these factors areunjustifiably ignored.
(11)The volume of production equals the volumeof sales, or changes in beginning and ending inventory levels areinsignificant in amount.

 Test your understanding 5
H Limited manufactures and sells two products – J and K. Annualsales are expected to be in the ratio of J:1 K:3. Total annual sales areplanned to be £420,000. Product J has a contribution to sales ratio of40% whereas that of product K is 50%. Annual fixed costs are estimatedto be £120,000.
Required:
What is the budgeted break-even sales value?


 Test your understanding 6
PER plc sells three products. The budgeted fixed cost for theperiod is £648,000. The budgeted contribution to sales ratio (C/Sratio) and sales mix are as follows:
Required:
What is the breakeven sales revenue?


 Test your understanding 7
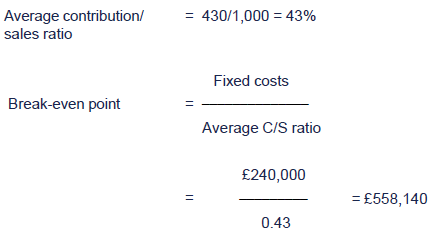
JK Ltd has prepared a budget for the next 12 months when it intendsto make and sell four products, details of which are shown below:

Budgeted fixed costs are £240,000 per annum and total assets employed are £570,000.
You are required:
(a) to calculate the total contribution earned by each product and their combined total contributions;
(b) to plot the data of your answer to (a) above in the form of a profit-volume graph;
(c) to explain your graph to management, to comment on the results shown and state the break-even point;
(d) to describe briefly three ways in which the overall contribution to sales ratio could be improved.

10 Chapter summary
Test your understanding answers

 Test your understanding 1 - Break-even analysis
| (a) |  |
| (b) |  |
| (c) |  |
| (d) | 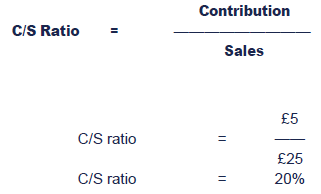 |
| (e) | 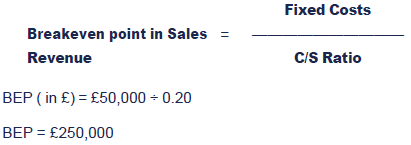 |
(f)

Required sales = (£40,000 + £50,000) ÷ 0.20
i.e.£450,000.


 Test your understanding 2 - RS
(a)Scenario I
| (i) |  |
| (ii) |  |
| (iii) |  |
Margin of safety expressed as a % of the budget : 5,750 units / 12,000 units = 48% approx.
(b)
(c)Scenario II
| (i) |  |
'Explain' : Graphically, point I (Fixed costs) remains the same at $(250,000), but RS would breakeven earlierat 4,167 units instead of 6,250 units. The profit line gradientsteepens. This is because a higher selling price increased contributionper unit and fixed costs are recovered quicker.
BEP ($ revenue) = $250,000 ÷ 0.50 = $500,000
| (ii) |  |
'Explain' : Graphically, point I (Fixed costs) remains the same at $(250,000), but RS would breakeven earlierat 4,167 units instead of 6,250 units. The profit line gradientsteepens. This is because a higher selling price increases contributionper unit, and fixed costs are recovered quicker.
The level of activity/number of units sold required to achieve a profit of £90,000 is therefore lower than in Scenario I.
| (iii) |  |
'Explain' : An increased contribution impacts favourably onthe margin of safety. Sales need to fall 65% short of budget before RSstarts making a loss – compared with 48% in scenario I.


 Test your understanding 3 - Single product
If the margin of safety budgeted in period 3 is 21.015%, then the breakeven number of units in the period is:
6,570 – (6,570 ´ 21.015%) = 5,189 units
At this level, contribution is equal to the level of fixed costs.
Contribution at this volume is:
5,189 ´ 35% ´ $72 = $130,763.
So fixed costs are $130,763.


 Test your understanding 4 - Multi-product
(a)


(b)

(c)

Firstly, products must be ranked according to their C/S ratios.Then assume that the products are sold in the order of highest C/S ratiofirst. The table below provides the workings to enable the chart to bedrawn.

The chart is, essentially, a profit/volume chart. Cumulative profitis plotted against cumulative sales revenue. Like P/V charts for singleproducts the line drawn starts at the fixed costs below the line.
Multi-product profit-volume chart


 Test your understanding 5
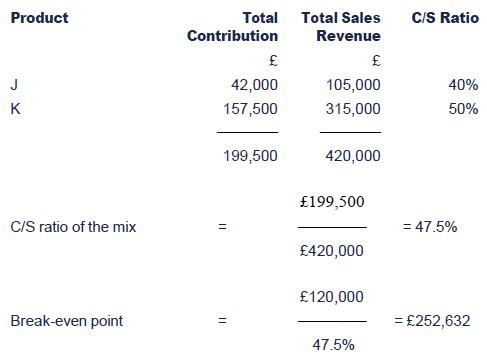
OR


 Test your understanding 6
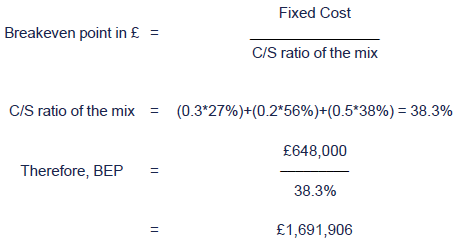


 Test your understanding 7
(a)

(b)

(c) The products are plotted in the order oftheir C/S ratios. The fixed costs of the company are £240,000. Thechart reveals that if only product K is produced, the company willgenerate a profit of £80,000. The profit of the company is maximised at£200,000. This is achieved by producing Products K, J and M only.
If all four products are produced then JK Ltd can expect a profitof £190,000 from sales revenue of £1,000,000. If all four productsare sold in the budget sales mix then the company will break even whenrevenue reaches £558,140. This point has been indicated on the graph.This point can also be calculated. Thus:
(d) The overall C/S ratio could be improved by:
- Changing the product mix in favour of products with above-average C/S ratios. In this example that would mean increasing production of Product K.
- Increasing sales revenue.
- Deleting product L.

|
Created at 5/24/2012 4:37 PM by System Account
(GMT) Greenwich Mean Time : Dublin, Edinburgh, Lisbon, London
|
Last modified at 5/25/2012 12:54 PM by System Account
(GMT) Greenwich Mean Time : Dublin, Edinburgh, Lisbon, London
|
|
|
|
 |
Rating
:
|
 Ratings & Comments
(Click the stars to rate the page) Ratings & Comments
(Click the stars to rate the page)
|
 |
Tags:
|
|
|
|
|