Chapter 20: Interpretation of financial statements
Chapter learning objectives
Upon completion of this chapter you will be able to:
- Understand the importance and purpose of analysis of financial statements
- Describe how the interpretation and analysis of financial statements is used in a business environment
- Explain the purpose of the interpretation of ratios
- Calculate key accounting ratios
- Profitability
- Liquidity
- Efficiency
- Position
- Explain the interrelationships between ratios
1 Interpreting financial information
Introduction
Financial statements on their own are of limited use. In thischapter we will consider how to interpret them and gain additionaluseful information from them.

 Users of financial statements
When interpreting financial statements it is important toascertain who are the users of accounts and what information they need:
- shareholders and potential investors – primarily concerned with receiving an adequate return on their investment, but it must at least provide security and liquidity
- suppliers and lenders – concerned with the security of their debt or loan
- management – concerned with the trend and level of profits, since this is the main measure of their success.
Other potential users include:
- bank managers
- financial institutions
- employees
- professional advisors to investors
- financial journalists and commentators.

Commenting on ratios
Ratios are of limited use on their own, thus, the followingpoints should serve as a useful checklist if you need to analyse thedata and comment on it:
- What does the ratio literally mean?
- What does a change in the ratio mean?
- What is the norm?
- What are the limitations of the ratio?
2 Profitability ratios
Gross profit margin
 Gross profit margin or percentage is:
This is the margin that the company makes on its sales, and would be expected to remain reasonably constant.
Since the ratio is affected by only a small number of variables, a change may be traced to a change in:
- selling prices – normally deliberate though sometimes unavoidable, e.g. because of increased competition
- sales mix – often deliberate
- purchase cost – including carriage or discounts
- production cost – materials, labour or production overheads
- inventory – errors in counting, valuing or cut-off, inventory shortages.
Gross profit margin
Comparing gross profit margin over time
If gross profit has not increased in line with sales revenue, you need to establish why not. Is the discrepancy due to:
- increased ‘purchase’ costs: if so, are the costs under the company’s control (i.e. does the company manufacture the goods sold)?
- inventory write-offs (likely where the company operates in a volatile marketplace, such as fashion retail)? or
- other costs being allocated to cost of sales – for example, research and development (R&D) expenditure?
Inter-company comparison of gross profit margin
Inter-company comparison of margins can be very useful but it isespecially important to look at businesses within the same sector. Forexample, food retailing is able to support low margins because of thehigh volume of sales. A manufacturing industry would usually need highermargins to offset lower sales volumes.
Low margins usually suggest poor performance but may be due toexpansion costs (launching a new product) or trying to increase marketshare. Lower margins than usual suggest scope for improvement.
Above-average margins are usually a sign of good managementalthough unusually high margins may make the competition keen to join inand enjoy the ‘rich pickings’.
Operating profit margin (net profit)
The operating profit margin or net profit margin is calculated as:
Any changes in operating profit margin should be considered further:
- Are they in line with changes in gross profit margin?
- Are they in line with changes in sales revenue?
- As many costs are fixed they need not necessarily increase/decrease with a change in revenue.
- Look for individual cost categories that have increased/decreased significantly.
Operating profit margin
This is affected by more factors than the gross profit margin butit is equally useful and if the company does not disclose a cost ofsales it may be used on its own in lieu of the gross profit percentage.
One of the many factors affecting the trading profit margin isdepreciation, which is open to considerable subjective judgement.Inter-company comparisons should be made after suitable adjustments toalign accounting policies.
By the time you have reached operating (net) profit, there are manymore factors to consider. If you are provided with a breakdown ofexpenses you can use this for further line-by-line comparisons. Bear inmind that:
- some costs are fixed or semi-fixed (e.g. property costs) and therefore not expected to change in line with revenue
- other costs are variable (e.g. packing and distribution, and commission).
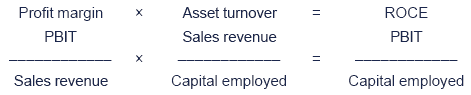
ROCE
Profit is measured as:
- operating (trading) profit, or
- the PBIT, i.e. the profit before taking account of any returns paid to the providers of long-term finance.
Capital employed is measured as:
- equity, plus interest-bearing finance, i.e. the long-term finance supporting the business.
ROCE for the current year should be compared to:
- the prior year ROCE
- a target ROCE
- the cost of borrowing
- other companies’ ROCE in the same industry.
ROCE
Once calculated, ROCE should be compared with:
- previous years’ figures – provided there have been no changes in accounting policies, or suitable adjustments have been made to facilitate comparison (note, however that the effect of not replacing non-current assets is that their value will decrease and ROCE will increase)
- the company’s target ROCE – where the company’s management has determined a target return as part of its budget procedure, consistent failure by a part of the business to meet the target may make it a target for disposal
- the cost of borrowings – if the cost of borrowing is say 10% and ROCE 7%, then further borrowings will reduce EPS unless the extra money can be used in areas where the ROCE is higher than the cost of borrowings
- other companies in same industry – care is required in interpretation, because of the possibility, noted above, of different accounting policies, ages of plant, etc.
The ratio also shows how efficiently a business is using itsresources. If the return is very low, the business may be better offrealising its assets and investing the proceeds in a high interest bankaccount! (This may sound extreme, but should be considered particularlyfor a small, unprofitable business with valuable assets such asproperty.) Furthermore, a low return can easily become a loss if thebusiness suffers a downturn.
Net asset turnover
The net asset turnover is:
It measures management’s efficiency in generating revenue from the net assets at its disposal:
- the higher, the more efficient.
Note that this can be further subdivided into:
- non-current asset turnover (by making non-current assets the denominator) and
- working capital turnover (by making net current assets the denominator).
Relationship between ratios
 ROCE can be subdivided into profit margin and asset turnover.
Profit margin is often seen as an indication of the quality ofproducts or services supplied (top-of-range products usually have highermargins).
Asset turnover is often seen as a measure of how intensively the assets are worked.
A trade-off may exist between margin and asset turnover.
- Low-margin businesses (e.g. food retailers) usually have a high asset turnover.
- Capital-intensive manufacturing industries usually have relatively low asset turnover but higher margins (e.g. electrical equipment manufacturers).
Two completely different strategies can achieve the same ROCE.
- Sell goods at a high profit margin with sales volume remaining low (e.g. designer dress shop).
- Sell goods at a low profit margin with very high sales volume (e.g. discount clothes store).
3 Liquidity and Efficiency ratios
Working capital ratios
There are two ratios used to measure overall working capital:
- the current ratio
- the quick or acid test ratio.
Current ratio
Current or working capital ratio:
The current ratio measures the adequacy of current assets to meet the liabilities as they fall due.
A high or increasing figure may appear safe but should be regarded with suspicion as it may be due to:
- high levels of inventory and receivables (check working capital management ratios)
- high cash levels which could be put to better use (e.g. by investing in non-current assets).
Current ratio
The current ratio measures the adequacy of current assets to meetthe company’s short-term liabilities. It reflects whether the companyis in a position to meet its liabilities as they fall due.
Traditionally, a current ratio of 2:1 or higher was regarded asappropriate for most businesses to maintain creditworthiness. However,more recently a figure of 1.5:1 is regarded as the norm.
The current ratio should be looked at in the light of what isnormal for the business. For example, supermarkets tend to have lowcurrent ratios because:
- there are few trade receivables
- there is a high level of trade payables
- there is usually very tight cash control, to fund investment in developing new sites and improving sites.
It is also worth considering:
- availability of further finance, e.g. is the overdraft at the limit? – very often this information is highly relevant but is not disclosed in the accounts
- seasonal nature of the business – one way of doing this is to compare the interest charges in the income statement with the overdraft and other loans in the statement of financial position; if the interest rate appears abnormally high, this is probably because the company has had higher levels of borrowings during the year
- long-term liabilities, when they fall due and how will they be financed
- nature of the inventory – where inventories are slow moving, the quick ratio probably provides a better indicator of short-term liquidity.
Quick ratio
Quick ratio (also known as the liquidity and acid test) ratio:
The quick ratio is also known as the acid test ratio because byeliminating inventory from current assets it provides the acid test ofwhether the company has sufficient liquid resources (receivables andcash) to settle its liabilities.
Quick ratio
Normal levels for the quick ratio range from 1:1 to 0.7:1.
Like the current ratio it is relevant to consider the nature of the business (again supermarkets have very low quick ratios).
Sometimes the quick ratio is calculated on the basis of asix-week time-frame (i.e. the quick assets are those which will turninto cash in six weeks; quick liabilities are those which fall due forpayment within six weeks). This basis would usually include thefollowing in quick assets:
- bank, cash and short-term investments
- trade receivables.
thus excluding prepayments and inventory.
Quick liabilities would usually include:
- bank overdraft which is repayable on demand
- trade payables, tax and social security
- dividends.
Income tax liabilities may be excluded.
When interpreting the quick ratio, care should be taken over the status of the bank overdraft.A company with a low quick ratio may actually have no problem in payingits amounts due if sufficient overall overdraft facilities areavailable.
Inventory turnover period
Inventory turnover period is defined as:
Alternative
An alternative is to express the inventory turnover period as a number of times:
An increasing number of days (or a diminishing multiple) impliesthat inventory is turning over less quickly which is regarded as a badsign as it may indicate:
- lack of demand for the goods
- poor inventory control
- an increase in costs (storage, obsolescence, insurance, damage).
However, it may not necessarily be bad where management are:
- buying inventory in larger quantities to take advantage of trade discounts, or
- increasing inventory levels to avoid stockouts.
Inventory days
Year-end inventory is normally used in the calculation ofinventory turnover. An average (based on the average of year-start andyear-end inventories) may be used to have a smoothing effect, althoughthis may dampen the effect of a major change in the period.
Inventory turnover ratios vary enormously with the nature of thebusiness. For example, a fishmonger selling fresh fish would have aninventory turnover period of 1–2 days, whereas a building contractormay have an inventory turnover period of 200 days. Manufacturingcompanies may have an inventory turnover ratio of 60–100 days; thisperiod is likely to increase as the goods made become larger and morecomplex.
For large and complex items (e.g. rolling stock or aircraft) theremay be sharp fluctuations in inventory turnover according to whetherdelivery took place just before or just after the year end.
A manufacturer should take into consideration:
- reliability of suppliers: if the supplier is unreliable it is prudent to hold more raw materials
- demand: if demand is erratic it is prudent to hold more finished goods.
Receivables collection period
This is normally expressed as a number of days:
The collection period should be compared with:
- the stated credit policy
- previous period figures.
Increasing accounts receivables collection period is usually a badsign suggesting lack of proper credit control which may lead toirrecoverable debts.
It may, however, be due to:
- a deliberate policy to attract more trade, or
- a major new customer being allowed different terms.
Falling receivables days is usually a good sign, though it could indicate that the company is suffering a cash shortage.
Receivables days
The trade receivables used may be a year-end figure or theaverage for the year. Where an average is used to calculate the numberof days, the ratio is the average number of days’ credit taken bycustomers.
For many businesses total sales revenue can safely be used, becausecash sales will be insignificant. But cash-based businesses likesupermarkets make the substantial majority of their sales for cash, sothe receivables period should be calculated by reference to credit salesonly.
The result should be compared with the stated credit policy. A period of 30 days or ‘at the end of the month following delivery’ are common credit terms.
The receivables days ratio can be distorted by:
- using year-end figures which do not represent average receivables
- factoring of accounts receivables which results in very low trade receivables
- sales on unusually long credit terms to some customers.
Payables payment period
This is usually expressed as:
This represents the credit period taken by the company from its suppliers.
The ratio is always compared to previous years:
- A long credit period may be good as it represents a source of free finance.
- A long credit period may indicate that the company is unable to pay more quickly because of liquidity problems.
If the credit period is long:
- the company may develop a poor reputation as a slow payer and may not be able to find new suppliers
- existing suppliers may decide to discontinue supplies
- the company may be losing out on worthwhile cash discounts.
Inmost sets of financial statements (in practice and in examinations) thefigure for purchases will not be available therefore cost of sales isnormally used as an approximation in the calculation of the accountspayable payment period.
4 Financial position
Introduction
The main points to consider when assessing the longer-term financial position are:
Gearing
Gearing ratios indicate:
- the degree of risk attached to the company and
- the sensitivity of earnings and dividends to changes in profitability and activity level.
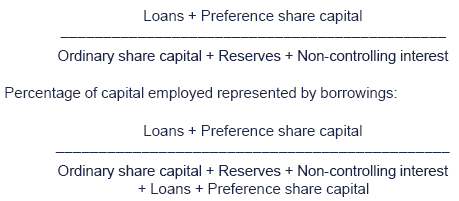
Preference share capital is usually counted as part of debt ratherthan equity since it carries the right to a fixed rate of dividend whichis payable before the ordinary shareholders have any right to adividend.
High and low gearing
In highly geared businesses:
- a large proportion of fixed-return capital is used
- there is a greater risk of insolvency
- returns to shareholders will grow proportionately more if profits are growing.
Low-geared businesses:
- provide scope to increase borrowings when potentially profitable projects are available
- can usually borrow more easily.
Gearing
Not all companies are suitable for a highly-geared structure. Acompany must have two fundamental characteristics if it is to usegearing successfully.
Relatively stable profits
Loan stock interest must be paid whether or not profits areearned. A company with erratic profits may have insufficient funds in abad year with which to pay the interest. This would result in theappointment of a receiver and possibly the liquidation of the company.
Suitable assets for security
Most issues of loan capital are secured on some or all of thecompany’s assets which must be suitable for the purpose. A companywith most of its capital invested in fast depreciating assets orinventory subject to rapid changes in demand and price would not besuitable for high gearing.
The classic examples of companies that are suited to high gearingare those in property investment and the hotel/leisure servicesindustry. These companies generally enjoy relatively stable profits andhave assets which are highly suitable for charging. Nonetheless, theseare industries that could be described as cyclical.
Companies not suited to high gearing would include those in theextractive, and high-tech, industries where constant changes occur.These companies could experience erratic profits and would generallyhave inadequate assets to pledge as security.
Measuring gearing
There are two methods commonly used to express gearing as follows.
Debt/equity ratio:
Interest cover
Interest cover indicates the ability of a company to pay interest out of profits generated:
- low interest cover indicates to shareholders that their dividends are at risk (because most profits are eaten up by interest payments) and
- the company may have difficulty financing its debts if its profits fall
- interest cover of less than two is usually considered unsatisfactory.
Interest cover
A business must have a sufficient level of long-term capital tofinance its long-term investment in non-current assets. Part of theinvestment in current assets would usually be financed by relativelypermanent capital with the balance being provided by credit fromsuppliers and other short-term borrowings. Any expansion in activitywill normally require a broadening of the long-term capital base,without which ‘overtrading’ may develop (see below).
Suitability of finance is also a key factor. A permanent expansionof a company’s activities should not be financed by temporary,short-term borrowings. On the other hand, a short-term increase inactivity such as the ‘January sales’ in a retail trading companycould ideally be financed by overdraft.
A major addition to non-current assets such as the construction of anew factory would not normally be financed on a long-term basis byoverdraft. It might be found, however, that the expenditure wastemporarily financed by short-term loans until construction wascompleted, when the overdraft would be ‘funded’ by a long-termborrowing secured on the completed building.
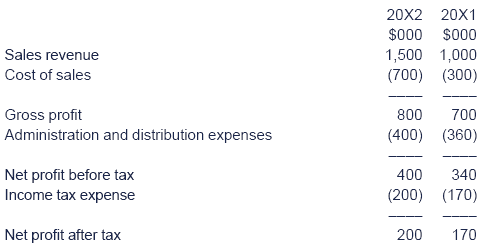
Example 1 – Interpretation
Statements of financial position and income statements for Ocean Motors are set out below.
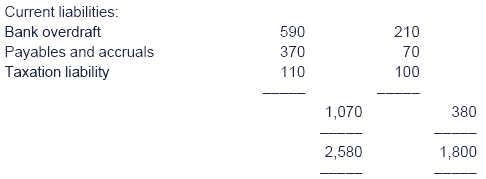
Statement of financial position for Ocean Motors

Income statements for Ocean Motors
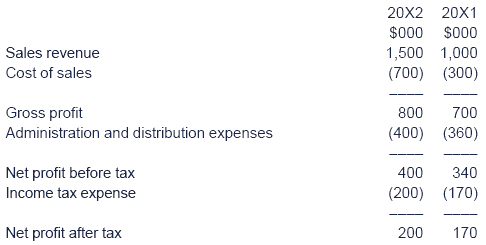
The dividend for 20X1 was $100,000 and for 20X2 was $110,000.Calculate the following ratios for Ocean Motors and briefly comment uponwhat they indicate:
Profitability ratios:
- gross profit margin
- operating profit margin
- ROCE
- net asset turnover.
Liquidity and working capital ratios:
- current ratio
- quick ratio
- inventory collection period
- accounts receivable collection period
- accounts payable payment period
Solution
Profitability ratios
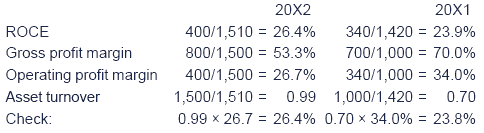
Comment
Key factors:
- revenue has increased by 50%
- gross profit margin significantly decreased maybe due to lowering of selling prices in order to increase market share and sales revenue
- operating profit margin has decreased in line with gross profit margin
- ROCE has increased due to the improvement in asset turnover.
Liquidity and working capital ratios

Comment
Overall the liquidity of the company would appear to be in some doubt:
- Both the current ratio and quick ratio appear very low although they have improved since the previous year.
- We do not know anything about the type of business therefore it is difficult to comment on these absolute levels of liquidity.
- Inventory turnover indicates that inventory is held for a considerable time and that this time is increasing.
- Accounts receivable collection period has deteriorated rapidly although given the increase in revenue this may be due to a conscious policy of offering extended credit terms in order to attract new custom.
- Accounts payable payment period has also more than doubled and is even longer than the period of credit taken by customers.
- Clearly the business is heavily dependent upon its overdraft finance.
5 Investor ratios
EPS
Limitations of EPS
EPS is used primarily as a measure of profitability, so anincreasing EPS is seen as a good sign. EPS is also used to calculate theprice earnings ratio which is dealt with below.
The limitations of EPS may be listed as follows.
- In times of rising prices EPS will increase as profits increase. Thus any improvement in EPS should be viewed in the context of the effect of price level changes on the company’s profits.
- Where there is a new share issue for cash, the shares are included for, say, half the year on the grounds that earnings will also increase for half of the year. However, in practice a new project funded by that cash does not begin generating normal returns immediately, so a new share issue is often accompanied by a decrease in EPS.
- EPS is dependent on an earnings figure which is subject to many judgements. Some elements of that earnings figure, such as movements on provisions, are particularly sensitive to different judgements.
- A single earnings figure should not be used as a key performance measure. This is to take a far too simplistic approach to the analysis of performance.
- EPS cannot be used as a basis of comparison between companies, as the number of shares in issue in any particular company is not related to the amount of capital employed. For example, two companies may have the same amount of capital employed but one company has 100,000 $1 shares in issue and reserves of $4,900,000. Another company may have 5 million 50c shares in issue and reserves of $2,500,000. If earnings are the same, EPS is different.
- EPS is an historical figure based on historical accounts. This is a disadvantage where it is used for a forward-looking figure such as the price earnings ratio.
- The diluted EPS (DEPS) is a theoretical measure of the effect of dilution on the basic EPS. DEPS should serve as a warning to equity shareholders that their future earnings will be affected by diluting factors. Thus, notes in the accounts relating to convertible loan stock, convertible preference shares and share options should all be analysed carefully.
P/E ratio
- Represents the market’s view of the future prospects of the share.
- High P/E suggests that high growth is expected.
P/E ratio
This is the most widely referred to stock market ratio, alsocommonly described as an earnings multiple. It is calculated as the‘purchase of a number of years’ earnings’, but it represents themarket’s consensus of the future prospects of that share. The higherthe P/E ratio, the faster the growth the market is expecting in thecompany’s future EPS. Correspondingly, the lower the P/E ratio, thelower the expected future growth.
Another aspect of interpreting it, is that a published EPS existsfor a year and therefore the P/E ratio given in a newspaper is generallybased on an increasingly out-of-date EPS. To give an extreme but simpleexample:
Company X
- For the year ended 31 December 20X6, EPS = 10c
- Overall market P/E ratio = 10.
- P/E ratio for X = 20 (because market expects above average growth).
- Market price at 30 April 20X7 (date of publication of previous year’s accounts) = $2.
- During the year, X does even better than expected and by 29 April 20X8, the share price is up to $3, therefore giving a P/E ratio of 30 (based on EPS for year ended 31 December 20X6).
- Year ended 31 December 20X7, EPS = 15c, announced on 30 April 20X8. This is in line with expectations so share price is unchanged and P/E ratio drops again to 20 ($3/15c).
The earnings yield is the reciprocal of the P/E ratio, calculatedas earnings as a percentage of market price. For Company X at 30 April20X8 it is 5% (15c as a % of $3).
Dividend yield
- can be compared to the yields available on other investment possibilities
- the lower the dividend yield, the more the market is expecting future growth in the dividend, and vice versa.
Dividend cover
- This is the relationship between available profits and the dividends payable out of the profits.
- The higher the dividend cover, the more likely it is that the current dividend level can be sustained in the future.
Example 2 – Interpretation
Given below are the income statements for Pacific Motors for the last two years.
Income statements
In 20X1 dividends were $100,000 and in 20X2 they were $110,000.
The company is financed by 1,200,000 $1 ordinary shares and let ussuppose that the market price of each share was $1.64 at 31 December20X2 and $1.53 at 31 December 20X1.
For each year calculate the following ratios and comment on them briefly:
- EPS
- P/E ratio
- dividend yield
- dividend cover.
Solution

Comment
There has not been a significant amount of change in the investorratios over the two years but the following specific comments could bemade:
- both EPS and dividend per share have increased by a small amount over the two years which is a policy often designed to satisfy shareholders
- the P/E ratio has declined which indicates that the market does not think as highly of the shares this year as last year
- dividend cover is slightly higher which means that a slightly higher proportion of the profits for the year have been retained within the business.
 Test your understanding 1
Interpretation of Financial Statements
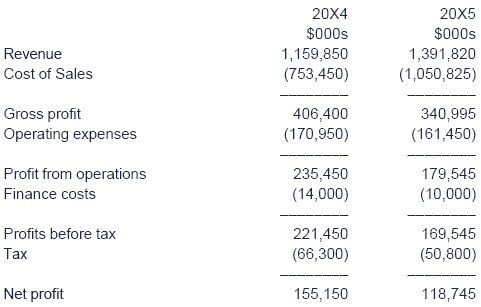
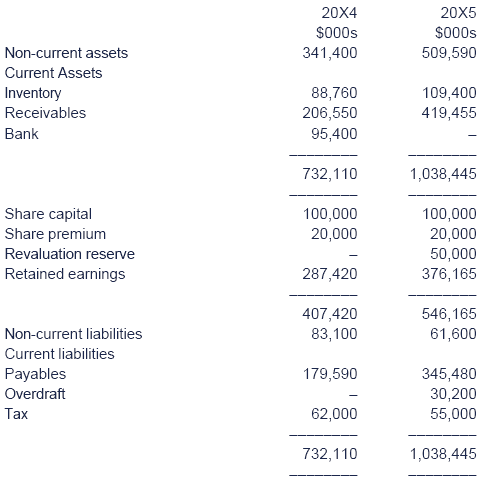
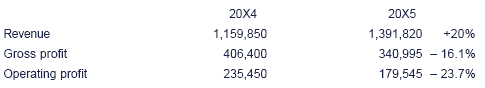
Neville is a company that manufactures and retails office products.Their summarised financial statements for the years ended 30 June 20X4and 20X5 are given below:
Income Statements for the year ended 30 June
Statements of Financial Position as at 30 June
The directors concluded that their revenue for the year ended 30June 20X4 fell below budget and introduced measures in the year end 30June 20X5 to improve the situation. These included:
- Cutting prices;
- Extending credit facilities to customers;
- Leasing additional machinery in order to be able to manufacture more products.
The directors’ are now reviewing the results for the year ended30 June 20X5 and have asked for your advice as an external businessconsultant, as to whether or not the above strategies have beensuccessful.
Required:
Prepare a report to the directors of Nevilleassessing the performance and position of the company in the year ended30 June 20X5 compared to the previous year and advise them on whether ornot you believe that their strategies have been successful.
Chapter summary
Test your understanding answers
Test your understanding 1
Neville
Report
To: Directors of Neville
From: Business Consultant
Date: XX.XX.XX
Subject: Performance of Neville
Introduction
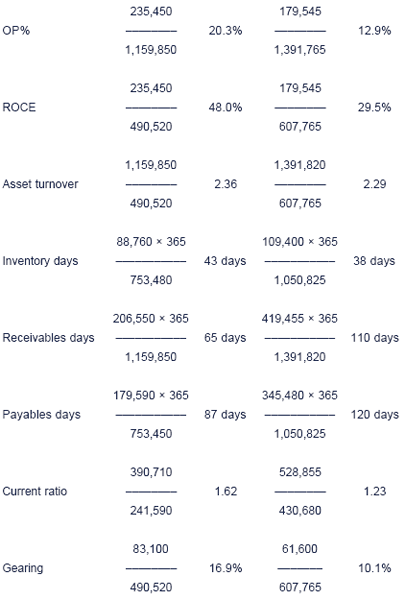
As requested I have analysed the financial statements of Nevillefor the year ended 30 June 20X5 compared to the previous year to assessthe performance and position of the entity and to determine whether thestrategies that you have implemented have been successful. The ratiosthat I have calculated are in an appendix to this report.
Performance
Profitability
The revenue of the entity has increased by 20% on last year. Itwould therefore appear that the strategy of cutting prices and extendingcredit facilities has attracted customers and generated an increase inrevenue. Whether or not the revenue is now above budget, as was thedirectors’ aim, is unknown.
Despite this increase however, the profitability of the company hasworsened with both gross profit and operating profit being lower thanthe previous year. Similarly the operating profit margin has declinedfrom 20.3% to 12.9%. There are likely to be several reasons behind thisdeterioration.
The reduction in prices of goods will have contributed to theworsening gross profit. To rectify this, Neville may considerapproaching their suppliers for some bulk-buying discounts on the basisthat since they are selling more items they will be purchasing morematerial from suppliers.
The move of leasing additional machinery may also have contributedto the lower profitability. Assuming that the leases are being treatedas operating leases the lease payments will be being expensed to theincome statement. Given that non-current liabilities have decreased thisyear it would appear that the leases are being treated as operatingleases and not finance leases.
The return on capital employed has dropped significantly from 48%to 29.5%. This is mainly due to the lower operating profit margins andreasons discussed above, as opposed to a decline in the efficient use ofassets since the asset utilisation has suffered only a slight fall.
The revaluation of non-current assets will also have contributed tothe fall in the return on capital employed and would explain why theasset utilisation has fallen slightly.
The revaluation will have caused additional depreciation charges inthe income statement and thus is another factor in the worseningprofits.
The increase in non-current assets is not fully explained by therevaluation. Hence it can be concluded that Neville have probablypurchased additional machinery (as well as leasing) to meet theincreased production needs. These new machines may not have been fullyoperational in the current year and so would also explain the lowerreturns. The higher depreciation charges will also have contributed tolower profits.
Position
Liquidity
Again, the company’s results are showing a worsening positionin this area with the current ratio declining from 1.62 to 1.23.
The cause for this would seem to be the extension of credit facilities to customers.
Receivables days have increased from an appropriate level of 65days to 110 days. Although the benefits of this strategy have been shownby the increase in revenue, it would seem that Neville have now allowedcustomers too much credit. It would be recommended that receivablesdays should be reduced to closer to 90 days.
As a result of the increase in the receivables collection period,Neville have been taking longer to pay their suppliers. Their payablesdays are now at an unacceptably high level of 120 days. This is likelyto be causing dissatisfaction with suppliers and would reduce theability of Neville being able to negotiate discounts as discussed above.
Inventory holding days have increased slightly from 38 days to 43days. This does not give any immediate cause for concern and is probablydue to increased production levels.
As a consequence of these factors, by the end of the year Neville are operating a significant overdraft.
Gearing
The gearing ratio has fallen from 16.9% to 10.1% as a result ofthe reduction in non-current liabilities. Assuming that these are loans,it would appear that Neville have further utilised their cash resourcesto repay these loans. This does not seem to have been a sensible movegiven their poor liquidity position.
The revaluation of non-current assets would also have contributed to the lowering of this ratio.
Further, the gearing ratio last year does not seem particularlyhigh – comparison with an industry average would confirm this – andthe company had a significant level of profits covering their financecosts.
Hence it would have seemed appropriate to have increased the longerterm debt of the company to finance the growth rather than increasingtheir current liabilities.
If Neville had leased their additional machinery under financeleases, it is likely that less would be charged to their incomestatement and so would improve their profitability while the subsequentincrease in the gearing ratio would not have caused significant concern.
Also, it was identified above that Neville may have purchasedadditional non-current assets. Given the gearing and liquiditypositions, it would seem that these have been financed from short-termsources rather than more appropriate long-term sources.
Summary
Although the directors’ initial aim of improving revenue hasbeen achieved with the measures taken, the strategies do not appear tohave been successful overall. The cutting of prices has caused loweringprofit margins and combined with additional lease expenses anddepreciation charges has resulted in a worsening profit situationoverall.
The extension of credit periods has again been successful to theextent that it has helped increase revenue but has caused a poorliquidity position.
It would seem that Neville are showing signs of overtrading.
To rectify the situation it would seem appropriate to increase the long-term debt of the company as a matter of priority.
Appendix
|
Created at 5/24/2012 3:41 PM by System Account
(GMT) Greenwich Mean Time : Dublin, Edinburgh, Lisbon, London
|
Last modified at 5/25/2012 12:53 PM by System Account
(GMT) Greenwich Mean Time : Dublin, Edinburgh, Lisbon, London
|
|
|
|
 |
Rating
:
|
") Ratings & Comments
(Click the stars to rate the page) Ratings & Comments
(Click the stars to rate the page)
|
|
|
Tags:
|
|
|
|
|