Chapter 7: Working capital management
Chapter learning objectives
Upon completion of this chapter you will be able to:
- define working capital and identify its elements
- explain the objectives of working capital management in terms of liquidity and profitability, and discuss the conflict between them
- explain the importance of working capital management to good financial management
- describe the principle and components of the cash operating cycle including the impact on it of accounts payable and receivable
- calculate the length of the cash operating cycle from supplied data
- calculate the current ratio and explain its relevance
- calculate the quick ratio and explain its relevance
- calculate the inventory turnover ratio and the inventory holding period and explain their relevance
- calculate the average collection period for receivables and explain its relevance
- calculate the average payable period for payables and explain its relevance
- calculate the length of a company's cash operating cycle by selecting relevant data from the company's accounts and discuss the implications for the company
- calculate the sales revenue/net working capital ratio and explain its relevance
- calculate the level of working capital investment in current assets from supplied data
- discuss the effect of a business' terms of trade on the length of the working capital cycle
- explain the policies a company may adopt on the level of investment in current assets
- discuss the effect of the industry in which the organisation operates on the length of the working capital cycle
- calculate the level of working capital investment in current assets by selecting relevant data from the company's accounts and discuss the implications for the company.
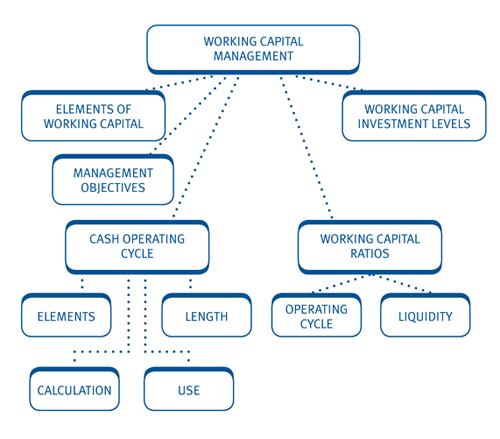
1 The elements of working capital
 Working capital is the capital available for conducting the day-to-dayoperations of an organisation; normally the excess of current assetsover current liabilities.
Working capital management is the management of all aspects of bothcurrent assets and current liabilities, to minimise the risk ofinsolvency while maximising the return on assets.
Investing in working capital has a cost, which can be expressed either as:
- the cost of funding it, or
- the opportunity cost of lost investment opportunities because cash is tied up and unavailable for other uses.

 Working capital and cash flows
Working capital is an investment which affects cash flows.
- When inventory is purchased, cash is paid to acquire it.
- Receivables represent the cost of selling goods or services to customers, including the costs of the materials and the labour incurred.
- The cash tied up in working capital is reduced to the extent that inventory is financed by trade payables. If suppliers give a firm time to pay, the firm's cash flows are improved and working capital is reduced.

2 The objectives of working capital management
The main objective of working capital management is to get the balance of current assets and current liabilities right.
This can also be seen as the trade-off between cash flow versus profits.
Current assets are a major financial position statement item andespecially significant to smaller firms. Mismanagement of workingcapital is therefore a common cause of business failure, e.g.:
- inability to meet bills as they fall due
- demands on cash during periods of growth being too great (overtrading)
- overstocking.
 Working capital management is a key factor in an organisation'slong-term success. The trade-off between liquidity and profitability andits role in determining a business' overall investment in workingcapital is fundamental to your understanding of working capitalmanagement for the examination.

 Profitability v liquidity
The decision regarding the level of overall investment in working capital is a cost/benefit trade-off – liquidity versus profitability, or cash flow versus profits.
Cash flow versus profit
It is worth while stressing the difference between cash flow andprofits. Cash flow is as important as profit. Unprofitable companies cansurvive if they have liquidity. Profitable companies can fail if theyrun out of cash to pay their liabilities (wages, amounts due tosuppliers, overdraft interest, etc.).
Some examples of transactions that have this 'trade-off' effect on cash flows and on profits are as follows:
(a)Purchase of non-current assetsfor cash. The cash will be paid in full to the supplier when the assetis delivered; however profits will be charged gradually over the life ofthe asset in the form of depreciation.
(b)Sale of goods on credit. Profitswill be credited in full once the sale has been confirmed; however thecash may not be received for some considerable period afterwards.
(c)With some payments such as taxthere may be a significant timing difference between the impact onreported profit and the cash flow.
Clearly, cash balances and cash flows need to be monitored just asclosely as trading profits. The need for adequate cash flow informationis vital to enable management to fulfil this responsibility.
Profitability versus liquidity
Liquidity in the context of working capital management means havingenough cash or ready access to cash to meet all payment obligationswhen these fall due. The main sources of liquidity are usually:
- cash in the bank
- short-term investments that can be cashed in easily and quickly
- cash inflows from normal trading operations (cash sales and payments by receivables for credit sales)
- an overdraft facility or other ready source of extra borrowing.
The basis of the trade off is where a company is able to improveits profitability but at the expense of tying up cash. For example:
- Receiving a bulk purchase discount (improved profitability) for buying more inventory than is currently required (reduced liquidity)
- Offering credit to customers (attracts more customers so improves profitability but reduces liquidity)
Sometimes, the opposite situation can be seen where a company canimprove its liquidity position but at the expense of profitability. Forexample. offering an early settlement discount to customers.


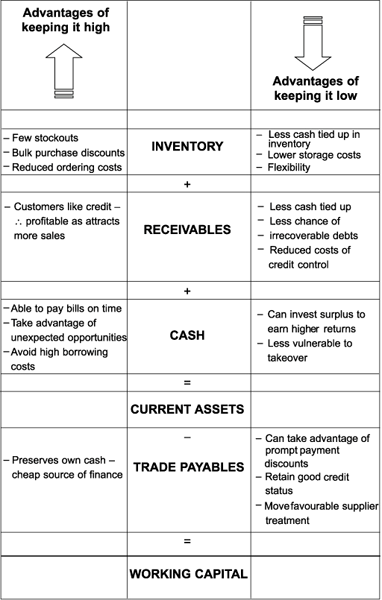
 Additional question - Profitability v liquidity
Fill in the blanks in the table to identify the advantages of having more or less working capital.

The answer to this question can be found after the chapter summary diagram at the end of this chapter.

3 Policies regarding working capital management
Aggressive versus conservative approach
A firm choosing to have a lower level of working capital than rivals is said to have an 'aggressive' approach, whereas a firm with a higher level of working capital has a 'conservative' approach.
An aggressive approach will result in higher profitability andhigher risk, while a conservative approach will result in lowerprofitability and lower risk.
Over-capitalisation and working capital
If there are excessive inventories, accounts receivable and cash,and very few accounts payable, there will be an over-investment by thecompany in current assets. Working capital will be excessive and thecompany will be over-capitalised.
Overtrading
Cash flow is the lifeblood of the thriving business. Effective andefficient management of the working capital investment is essential tomaintaining control of business cash flow. Management must have fullawareness of the profitability versus liquidity trade-off.
For example, healthy trading growth typically produces:
- increased profitability
- the need to increase investment in non-current assets and working capital.
In contrast to over-capitalisation, if the business does not haveaccess to sufficient capital to fund the increase, it is said to be"overtrading". This can cause serious trouble for the business as it isunable to pay its business creditors.
In the exam, you might be expected to diagnose overtrading frominformation given about a company. You should look out for thefollowing:
- A rapid increase in turnover
- A rapid increase in the volume of current assets
- Most of the increase in assets being financed by credit
- A dramatic drop in the liquidity ratios (see next section)
4 Working capital ratios – liquidity
 Two key measures, the current ratio and the quick ratio, are used toassess short-term liquidity. Generally a higher ratio indicates betterliquidity.
Current ratio
 Measures how much of the total current assets are financed by current liabilities.
A measure of 2:1 means that current liabilities can be paid twice over out of existing current assets.
Quick (acid test) ratio
 The quick or acid test ratio:
- measures how well current liabilities are covered by liquid assets
- is particularly useful where inventory holding periods are long.
A measure of 1:1 means that the company is able to meet existing liabilities if they all fall due at once.

 Liquidity ratios
These liquidity ratios are a guide to the risk of cash flowproblems and insolvency. If a company suddenly finds that it is unableto renew its short-term liabilities (for instance if the bank suspendsits overdraft facilities) there will be a danger of insolvency unlessthe company is able to turn enough of its current assets into cashquickly.
In general, high current and quick ratios are considered 'good' inthat they mean that an organisation has the resources to meet itscommitments as they fall due. However, it may indicate that workingcapital is not being used efficiently, for example that there is toomuch idle cash that should be invested to earn a return.
Conventional wisdom has it that an ideal current ratio is 2 and anideal quick ratio is 1. It is very tempting to draw definite conclusionsfrom limited information or to say that the current ratio should be 2,or that the quick ratio should be 1.
However, this is not very meaningful without taking into accountthe type of ratio expected in a similar business or within a businesssector. Any assessment of working capital ratios must take into accountthe nature of the business involved.
For example a supermarket business operating a JIT system will havelittle inventory and since most of sales are for cash they will havefew receivables. In addition the ability to negotiate long creditperiods with suppliers can result in a large payables figure. This canresult in net current liabilities and a current ratio below 1 – butdoes not mean the business has a liquidity problem.
Some companies use an overdraft as part of their long-term finance,in which case the current and quick ratios may appear worryingly low.In such questions you could suggest that the firm reschedule theoverdraft as a loan. Not only would this be cheaper but it would alsoimprove liquidity ratios.

5 The cash operating cycle
The elements of the operating cycle
 The cash operating cycle is the length of time between the company'soutlay on raw materials, wages and other expenditures and the inflow ofcash from the sale of goods.
 The faster a firm can 'push' items around the cycle the lower its investment in working capital will be.

 The cash operating cycle
The cash operating cycle reflects a firm's investment in workingcapital as it moves through the production process towards sales. Theinvestment in working capital gradually increases, first being only inraw materials, but then in labour and overheads as productionprogresses. This investment must be maintained throughout the productionprocess, the holding period for finished goods and up to the finalcollection of cash from trade receivables.
(Note: The net investment can be reduced by taking trade credit from suppliers.)

Calculation of the cash operating cycle
For a manufacturing business, the cash operating cycle is calculated as:
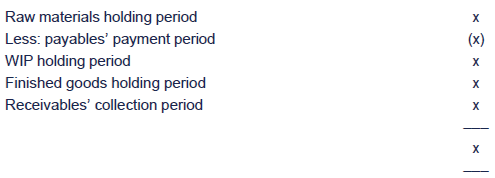
For a wholesale or retail business, there will be no raw materials or WIP holding periods, and the cycle simplifies to:

The cycle may be measured in days, weeks or months and it isadvisable, when answering an exam question, to use the measure used inthe question.

 Test your understanding 1 – Cash operating cycle
A company has provided the following information:

Calculate the length of the operating cycle

Factors affecting the length of the operating cycle
Length of the cycle depends on:
- liquidity versus profitability decisions
- terms of trade
- management efficiency
- industry norms, e.g. retail versus construction.
The optimum level of working capital is the amount that results inno idle cash or unused inventory, but that does not put a strain onliquid resources.

 The length of the cycle
The length of the cycle depends on how the balancing act betweenliquidity and profitability is resolved, the efficiency of managementand the nature of the industry.
The optimum level is the amount that results in no idle cash orunused inventory, but that does not put a strain on liquid resources.Trying to shorten the cash cycle may have detrimental effects elsewhere,with the organisation lacking the cash to meet its commitments andlosing sales since customers will generally prefer to buy from supplierswho are prepared to extend trade credit, and who have items availablewhen required.
Additionally, any assessment of the acceptability or otherwise ofthe length of the cycle must take into account the nature of thebusiness involved.
A supermarket chain will tend to have a very low or negative cycle– they have very few, if any, credit customers, they have a highinventory turnover and they can negotiate quite long credit periods withtheir suppliers.
A construction company will have a long cycle – their projectstend to be long-term, often extending over more than a year, and whilstprogress payments may be made by the customer (if there is one), thebulk of the cash will be received towards the end of the project.
The amount of cash required to fund the operating cycle will increase as either:
- the cycle gets longer
- the level of activity/sales increases.
This can be summed up as follows:
Where level of activity (sales) is constant and the number of daysof the operating cycle increase the amount of funds required for workingcapital will increase in approximate proportion to the number of days.
Where the cycle remains constant but activity (sales) increase thefunds required for working capital will increase in approximateproportion to sales.
By monitoring the operating cycle the manager gains a macro view ofthe relative efficiency of the working capital utilisation. Further itmay be a key target to reduce the operating cycle to improve theefficiency of the business.

6 Working capital ratios – operating cycle
The periods used to determine the cash operating cycle are calculated by using a series of working capital ratios.
The ratios for the individual components (inventory, receivablesand payables) are normally expressed as the number of days/weeks/monthsof the relevant income statement figure they represent.

 Illustration 1 – Working capital ratios – operating cycle
X Co has the following figures from its most recent accounts:
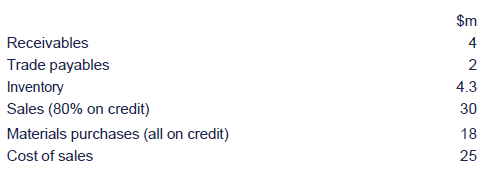
Required:
Calculate the relevant working capital ratios. Round your answers to the nearest day.

Inventory holding period
 The length of time inventory is held between purchase and sale.
Calculated as:


 Solution to Illustration
Solution 1 to illustration 1

In some questions, a more detailed breakdown of inventory may beprovided, with values given for raw materials, work-in-progress andfinished goods stock. Where this is the case, more detailed calculationscan be performed as follows:
Raw material inventory holding period
 The length of time raw materials are held between purchase and being used in production.
Calculated as:

NB. Where usage cannot be calculated, purchases gives a good approximation.

 Solution to illustration
Solution 2 to illustration 1
Suppose you are told that raw materials inventory was $1m of thetotal inventory held and that materials usage was $20m. The raw materialinventory holding period could be calculated as:

 WIP holding period
The length of time goods spend in production.
Calculated as:

NB. Where production cost cannot be calculated, cost of goods sold gives a good approximation.

 Solution to illustration
Solution 3 to illustration 1
If you were told this company had a WIP balance of $1.3m and atotal production cost of $23m, the WIP holding period could becalculated as:

 Finished goods inventory period
The length of time finished goods are held between completion or purchase and sale.
Calculated as:

For all inventory period ratios, a low ratio is usually seen as asign of good working capital management. It is very expensive to holdinventory and thus minimum inventory holding usually points to goodpractice.

 Solution to illustration
Solution 4 to illustration 1
If you were told that the remaining inventory of $2m was finishedgoods inventory, you could calculate the finished goods holding periodas:
Note: the total of the three individual holding periods calculatedis slightly more than the one calculated as an overall inventory holdingperiod. This is because the more detailed approach allows us to takeaccount of the costs within each element by using materials usage andproduction cost within the calculation rather than just cost of sales.The more detailed approach is more accurate but won't always be possibledue to the information available.


 Inventory turnover
For each ratio, the corresponding turnover ratio can be calculated as:

Generally this is less useful in the examination.
Using finished goods information from illustration 1:

Thus finished goods inventory turns round/is turned into sales 12.5 times in the year.

 Trade receivables days
The length of time credit is extended to customers.
Calculated as:

Generally shorter credit periods are seen as financially sensiblebut the length will also depend upon the nature of the business.

 Solution to illustration
Solution 5 to illustration 1


 Interpreting trade receivables collection periods
Businesses which sell goods on credit terms specify a creditperiod. Failure to send out invoices on time or to follow up late payerswill have an adverse effect on the cash flow of the business. Thereceivables collection period measures the average period of creditallowed to customers.
In general, the shorter the collection period the better becausereceivables are effectively 'borrowing' from the company. Remember,however, that the level of receivables reflects not only the ability ofthe credit controllers but also the sales and marketing strategyadopted, and the nature of the business. Any change in the level ofreceivables must therefore be assessed in the light of the level ofsales.

 Trade payables days
The average period of credit extended by suppliers.
Calculated as:


 Solution to illustration
Solution 6 to illustration 1

Generally, increasing payables days suggests advantage is being taken of available credit but there are risks:
- losing supplier goodwill
- losing prompt payment discounts
- suppliers increasing the price to compensate.
The operating cycle
The ratios can then be brought together to produce the cash operating cycle.

The cash operating cycle tells us it takes X Co 83 days betweenpaying out for material inventories and eventually receiving cash backfrom customers.
As always this must then be compared with prior periods or industry average for meaningful analysis.
Additional points for calculating ratios
The ratios may be needed to provide analysis of a company'sperformance or simply to calculate the length of the operating cycle.
 There are a few simple points to remember which will be of great use in the examination:
- Where the period is required in days, the multiple in the ratios is 365, for months the multiple is 12, or 52 for weeks.
- To avoid getting a result that is unduly influenced by unusual balances at a period in time, your calculations should ideally use average balances for inventory, receivables and payables. If not given, these could be calculated by taking the opening and closing financial position statement figures and dividing by two. If you are required to compare ratios between two financial position statements, it is acceptable to base each holding period on financial position statement figures, rather than an average, in order to see whether the ratio has increased or decreased.
- For each ratio calculated above, the corresponding turnover ratio can be calculated by inverting the ratio given and removing the multiple.
- When using the ratios to appraise performance, it is essential to compare the figure with others in the industry or identify the trend over a number of periods.
- Ratios have their limitations and care must be taken because:
- the financial position statement values at a particular time may not be typical
- balances used for a seasonal business may not represent average levels, e.g. a fireworks manufacturer
- ratios can be subject to window dressing/manipulation
- ratios concern the past (historic) not the future
- figures may be distorted by inflation and/or rapid growth.
Working capital turnover
One final ratio that relates to working capital is the working capital turnover ratio and is calculated as:
This measures how efficiently management is utilising itsinvestment in working capital to generate sales and can be useful whenassessing whether a company is overtrading.
It must be interpreted in the light of the other ratios used.

 Test your understanding 2 – Calculation of cash operating cycle
Marlboro Co estimates the following figures for the coming year.

Inventory levels are constant.
- Raw materials are 80% of cost of sales – all on credit.
Required:
Calculate the cash operating cycle

 From an examination point of view, calculating the ratios is only thestart – interpretation is the key to a good answer. Try to build acumulative picture, e.g. the current ratio looks good until we find outfrom calculating the inventory holding period that there are high levelsof illiquid inventory.
Do not be afraid to point out further information that may berequired to provide a better interpretation of your calculations, e.g.the company credit policy, industry benchmarks, etc.

 Test your understanding 3 – Appraisal of working capital
You have been given the following information for a company:
Summarised statements of financial position at 30 June
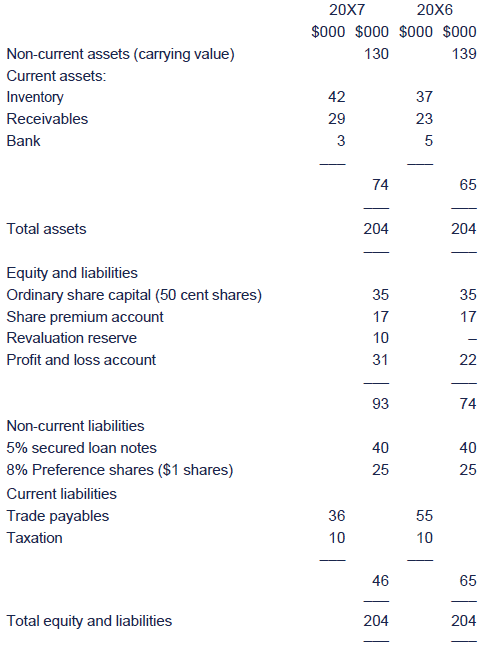
Summarised income statements for the year ended 30 June

Required:
(a)Calculate the liquidity ratios in 20X6 and 20X7
(b)Calculate the length of the cash operating cycle in 20X6 and 20X7
(c)Comment on your results and appraise how effectively the working capital is being managed

7 Working capital investment levels
The working capital ratios shown above can be used to predict thefuture levels of investment (the financial position statement figure)required. This is done by re-arranging the formulas. For example:


 Working capital investment levels
The level of working capital required is affected by the following factors:
(1)The nature of the business, e.g. manufacturing companies need more inventory than service companies.
(2)Uncertainty in supplierdeliveries. Uncertainty would mean that extra inventory needs to becarried in order to cover fluctuations.
(3)The overall level of activity of the business. As output increases, receivables, inventory, etc. all tend to increase.
(4)The company's credit policy. The tighter the company's policy the lower the level of receivables.
(5)The length of the operatingcycle. The longer it takes to convert material into finished goods intocash the greater the investment in working capital
(6)The credit policy of suppliers.The less credit the company is allowed to take, the lower the level ofpayables and the higher the net investment in working capital.


 Test your understanding 4 – Working capital investment levels
X plc has the following expectations for the forthcoming period.

The following working capital ratios are expected to apply.

Required:
Compute the working capital requirement.


 Additional question - Working capital inv levels (1)
A company's annual sales are $8 million with a mark-up on cost of60%. It normally settles payables two months after purchases are made,holding one month's worth of demand in inventory. It allows receivables1½ months' credit and its cash balance currently stands at $1,250,000.
What are its current and quick ratios?
The answer to this question can be found after the chapter summary diagram at the end of this chapter.


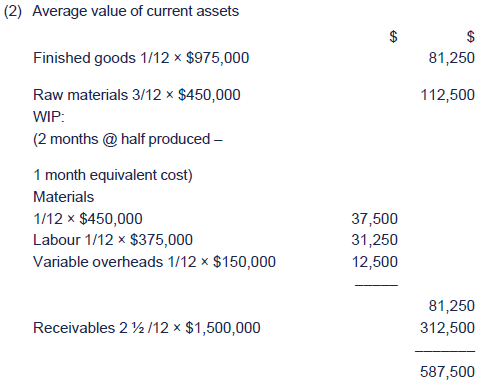
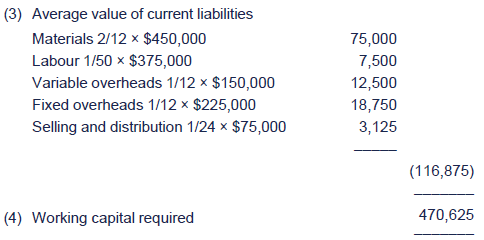
 Additional question - Working capital inv levels (2)
The following data relate to Mugwump Co, a manufacturing company.

Average statistics relating to working capital are as follows:
- receivables take 2½ months to pay
- raw materials are in inventory for three months
- WIP represents two months' half-produced goods
- finished goods represent one month's production
- credit is taken
WIP and finished goods are valued at the cost of material, labour and variable expenses.
Compute the working capital requirement of Mugwump Co assuming that the labour force is paid for 50 working weeks in each year.
The answer to this question can be found after the chapter summary diagram at the end of this chapter.

Chapter summary

 Answer to additional question - Profitability v liquidity


 Answer to additional question - Working capital inv levels (1)
Step 1 Calculate annual cost of sales, using the cost structure.

Step 2 Calculate payables, receivables and inventory.

Step 3 Calculate the ratios.


 Answer to additional question - Working capital inv levels (2)


Test your understanding answers

 Test your understanding 1 – Cash operating cycle


 Test your understanding 2 – Calculation of cash operating cycle
Income statement

Cash operating cycle
Raw materials holding period

Trade payables days

WIP holding days

Finished goods holding period

Receivables collection period


 Test your understanding 3 – Appraisal of working capital
The current ratio:
The quick (or acid test) ratio:
Both of these ratios show an improvement. The extent of the changebetween the two years seems surprising and would require furtherinvestigation. It would also be useful to know how these ratios comparewith those of a similar business, since typical liquidity ratios forsupermarkets, say, are quite different from those for heavy engineeringfirms.
In 20X7 current liabilities were well covered by current assets.Liabilities payable in the near future are 70% covered by cash andreceivables (a liquid asset, close to cash).
To better understand the liquidity ratios we can then look at each individual component of working capital:
The inventory holding period:
The inventory holding period has lengthened. In general, theshorter the stock holding period the better. It is very expensive tohold stock and thus minimum stock holding usually points to goodmanagement.
The current ratio calculation now seems less optimistic,considering the holding period for inventory of 92 days. Inventory thattakes nearly four months to sell is not very liquid! It would be betterto focus attention on the acid test ratio.
Receivables days:
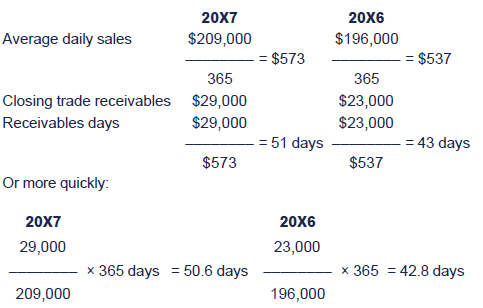
Compared with 20X6, the receivables collection period has worsenedin 20X7. It would be important to establish the company policy on creditallowed. If the average credit allowed to customers was, say, 30 days,then something is clearly wrong. Further investigation might revealdelays in sending out invoices or failure to 'screen' new customers.
This situation suggests yet a further review of the liquidityratios. The acid test ratio ignores inventory but still assumesreceivables are liquid. If debt collection is a problem then receivablestoo are illiquid and the company could struggle to pay its currentliabilities were they all to fall due in a short space of time.
Payables days:

The payables' payment period has reduced substantially from lastyear. It is, however, in absolute terms still a high figure. Often,suppliers request payment within 30 days. The company is taking nearlythree months. Trade creditors are thus financing much of the workingcapital requirements of the business, which is beneficial to thecompany.
A high level of creditor days may be good in that it means that allavailable credit is being taken, but there are three potentialdisadvantages of taking extended credit:
- Future supplies may be endangered.
- Availability of cash discounts is lost.
- Suppliers may quote a higher price for the goods knowing the company takes extended credit.
Additionally when viewed alongside the previous ratios calculated,this might suggest a cash flow problem causing suppliers to be leftunpaid.
Length of the operating cycle:

Our example shows that, in 20X7, there is approximately a 62-daygap between paying cash to suppliers for goods, and receiving the cashback from customers. However, in 20X6, there was the somewhat unusualsituation where cash was received from the customers, on average, morethan 3 days before the payment to suppliers was needed.


 Test your understanding 4 – Working capital investment levels
We need to use the ratios to calculate financial position statementvalues in order to construct the projected working capital position.


|
Created at 5/24/2012 4:12 PM by System Account
(GMT) Greenwich Mean Time : Dublin, Edinburgh, Lisbon, London
|
Last modified at 5/25/2012 12:54 PM by System Account
(GMT) Greenwich Mean Time : Dublin, Edinburgh, Lisbon, London
|
|
|
|
 |
Rating
:
|
 Ratings & Comments
(Click the stars to rate the page) Ratings & Comments
(Click the stars to rate the page)
|
 |
Tags:
|
|
|
|
|