Chapter 8: Divisional performance appraisal and transfer pricing
Chapter learning objectives
Upon completion of this chapter you will be able to:
- describe, compute and evaluate performance measures relevant in a divisionalised organisation structure including ROI, RI and Economic value added (EVA)
- evaluate and apply the value-based management approaches to performance management
- discuss the need for separate measures in respect of managerial and divisional performance
- discuss the circumstances in which a transfer pricing policy may be needed in a divisionalised organisation and discuss the necessary criteria for its design
- demonstrate and evaluate, using supplied data, the use of alternative bases for transfer pricing
- explain and demonstrate issues that require consideration when setting transfer prices in multinational companies
- evaluate the use and application of strategic models in assessing the business performance of an entity, such as Ansoff, Boston Consulting Group and Porter.
- discuss the problems encountered in planning, controlling and measuring performance levels, e.g. productivity, profitability, quality and service levels, in complex business structures.
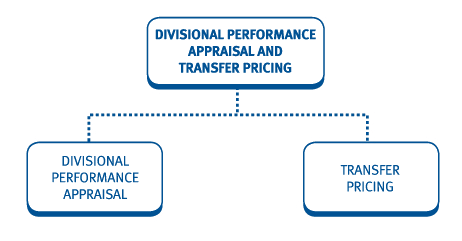
1 Exam focus

Student Accountant articles: visit the ACCA website, www.accaglobal.com, to review the following articles on the topics in this chapter:
- Transfer pricing - October 2009
- Economic value added - October 2007
- Business strategy and performance models - April 2006
2 Introduction to divisional performance management
A feature of modern business management is the practice ofsplitting a business into semi-autonomous units with devolved authorityand responsibility. Such units could be described as 'divisions',subsidiaries or strategic business units (SBUs) but the principles arethe same.
This chapter will review some of the methods available forappraising divisional performance. However, before looking at these itis worth noting that divisional structures may result in the followingproblems:
- Co-ordination - how to co-ordinate different divisions to achieve overall corporate objectives.
- Goal congruence – managers will be motivated to improve the performance of their division, possibly at the expense of the larger organisation.
- Head office costs - whether/how head office costs should be reapportioned.
- Transfer prices - how transfer prices should be set as these effectively move profit from one division to another.
- Controllability - divisional managers should only be held accountable for those factors that they can control. The performance of a division's manager must be appraised separately to the performance of the division. It may be difficult to determine exactly what is and what is not controllable.
- Inter-dependence of divisions - the performance of one division may depend to some extent on others, making it difficult to measure performance levels.

 Illustration 1 - Inter-dependence of divisions
Suppose division A makes components that are subsequently used indivision B to make the finished item that is then sold to customers. Thefollowing are examples of areas where the performance of B will beaffected by problems in A.
- Productivity – suppose some staff in division A are ill, slowing down the supply of components to division B. This will slow down division B as well, unless adequate inventories are held.
- Profitability – suppose the transfer pricing system includes an element of actual cost. Cost overruns in A would be passed on to B.
- Quality – poor quality work in A will ultimately compromise the quality of the finished product.
- Service levels – customer queries to B could involve A's component in which case they need to be re-directed. Division A may not be as customer-focused as B, compromising customer goodwill.


 Management of a division
The management of a division are normally remunerated on a basislinked to the performance they achieve. Typically, they are givenperformance targets and only if they achieve those targets do they get asalary bonus.
The central idea is that the manager of a division is in the sameposition as an independent entrepreneur. If he experiences the risks andrewards of business ownership, then he/she will act in a mannercalculated to maximise the value of the division – or that is thetheory. The modern variation on this theme is to give management 'shareoptions' – the right to buy shares at a given price. If the shareprice performs well, (and the stock market is a good judge of businessperformance), then the manager benefits. The theory is that thispromotes goal congruence between managers and shareholders.
Having decentralised, it is essential that senior managementmonitor and control the performance of the divisions and of those peoplewith direct responsibility for those divisions. An accountinginformation system (a management control system) must be in place toallow for divisional assessment. The system used must have a closebearing on divisional goals and must recognise that some costs of adivision will be controllable by its managers and some will not.

3 Numerical measures of divisional performance
Key considerations
When assessing divisional performance it is vital that the measures used match the type of division:

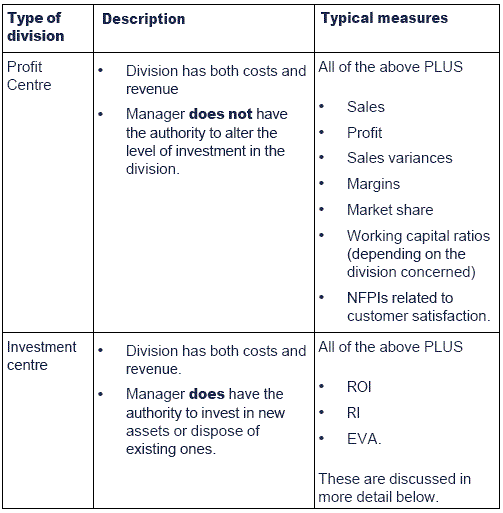
4 Return on Investment (ROI)
4.1 What is ROI?
ROI is the divisional equivalent of ROCE.
Decision rule: If ROI > Cost of capital (required return), then accept the project.
4.2 Advantages and disadvantages of ROI
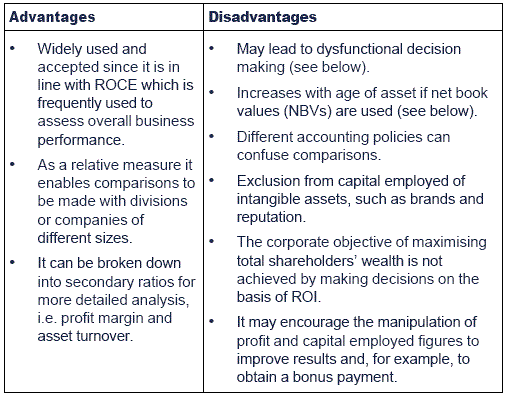
Dysfunctional decision making
Where ROI is used as a performance measure – management may onlytake decisions which will increase divisional ROI, regardless of widercorporate benefits.

 Test your understanding 1
Managers within MV plc are appraised on the ROI of their division. The company's cost of capital is 15%.
Jon, a divisional manager, has the following results:

Within his division, the purchase of a new piece of equipment hasbeen proposed. This equipment would cost $20,000, would yield an extra$4,000 of profit and would have many other non-financial andenvironmental benefits to the division and the company as a whole.
Required:
Will Jon invest in the new equipment? Is this the correct decision for the company?

Age of assets
The ROI will increase with the age of the asset. This may encouragedivisional managers to hold onto old, and potentially inefficientassets, rather than investing in new ones.

 Test your understanding 2
McKinnon Co sets up a new division in Blair Atholl investing$800,000 in fixed assets with an anticipated useful life of 10 years andno scrap value. Annual profits before depreciation are expected to be asteady $200,000.
You are required to calculate the division's ROI forits first three years based on the opening book value of assets. Commenton your results.

5 Residual income
5.1 What is residual income (RI)?

Decision rule: accept the project if the RI is positive.
5.2 Advantages and disadvantages of RI
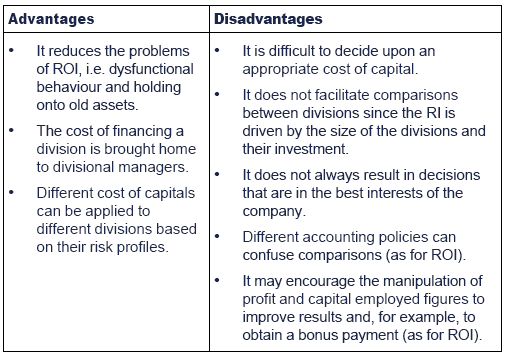

 Illustration 2 – Residual Income (RI)
Black Dog Inc has the following financial performance:

Black Dog wishes to evaluate on the basis of residual incomewhether to accept a new possible investment costing $10,000 which wouldearn profit of $2,000 pa.
Solution
Current RI = 40,000 – (10% × $150,000) = $25,000
Revised RI = 42,000 – (10% × $160,000) = $26,000
Decision: accept the project as RI after project > current RI.


 Test your understanding 3
Division Z has the following financial performance:

Required:
Would the division wish to accept a new possibleinvestment costing $10,000 which would earn profit $2,000 pa if theevaluation was on the basis of:
(a) ROI
(b) RI?
Is the division's decision in the best interests of the company?


 Test your understanding 4
KM Ltd is considering a new project and has gathered the following data:
The initial investment is $66 million which will be required at thebeginning of the year. The project has a three year life with a nilresidual value. Depreciation is calculated on a straight-line basis.
The project is expected to generate revenue of $85m in year 1, $90m in year 2 and $94m in year 3. These values may vary by 6%.
The direct costs will be $50m in year 1, $60m in year 2 and $70m in year 3. These may vary by 8%.
Cost of capital may also vary from 8% to 10% for the life of the project.
Use the written down value of the asset at the start of each year to represent the value of the asset for the year.
Ignore tax.
Required:
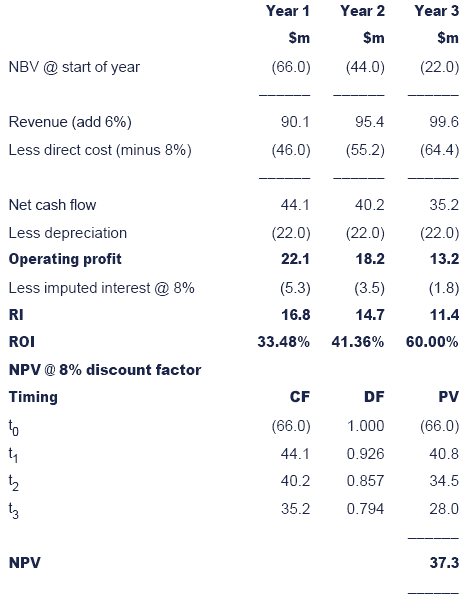
Prepare two tables showing operating profit, residualincome and return on investment for each year of the project and theNPV for:
(1) The best outcome
(2) The worst outcome

Question focus: Question 13 in chapter 13 is a complexquestion on ROI, RI and NPV. Even if you do not have time to completethe entire question it is worth reviewing it since it will broaden yourknowledge of the subject area and shows that exam questions in thispaper will require an in depth application of knowledge.
6 Annuity depreciation

 Annuity depreciation
- As discussed, the use of ROI and RI does not always result in decisions that are in the best interests of the company.
- Specifically, a project with a positive net present value (NPV) at the company's cost of capital may show poor ROI or RI results in early years, leading to its rejection by the divisional manager.
- Annuity depreciation is one attempt to resolve this problem.
Example:
Division X is currently generating a ROI of 12%. It is considering anew project. This requires an investment of $1.4 million and isexpected to yield net cash inflows of $460,000 per annum for the nextfour years. None of the initial investment will be recoverable at theend of the project.
The company has a cost of capital of 8%. Annual accounting profitsare to be assumed to equal annual net cash inflows less depreciation,and tax is to be ignored.
Required:
(a)Calculate and comment of the NPV of the project.
(b)Calculate and comment on the ROI and RI of the project.
(c)Calculate and comment on the ROI and RI of the project using annuity depreciation.
(d)Calculate and comment on the ROI and RI of the project at the project IRR of 12%.
Solution:
(a)NPV calculation

NPV =123,520
Conclusion: the project has a positive NPV and is therefore worthwhile accepting from the company's point of view.
(b)ROI and RI

Conclusion: If the manager's performance is measured (andrewarded) on the basis of RI or ROI, he is unlikely to accept theproject. The first year's RI is negative, and the ROI does not exceedthe company's cost of capital until year 2, or the ROI currently beingearned until year 3. Divisional managers will tend to take a short-termview. More immediate returns are more certain, and by year 3 he may havemoved jobs.
(c)ROI and RI using annuity depreciation
Annuity depreciation is calculated as follows:
Step 1: Calculate the equivalent annual cost (EAC) of the initial investment
EAC = Initial investment ÷ cumulative discount factor at the company's cost of capital
= $1.4m ÷ 3.312
= $422,705
Step 2: Calculate annual depreciation
Annual depreciation = EAC – interest on opening NBV
e.g for year 1 = 422,705 – (1,400,000 × 8%)
= $310,705
The ROI and RI can now be calculated as follows:

Conclusion: The project now has an equal, positive, RI overits life, which will encourage the manager to invest, a decisioncompatible with that using NPV.
However, there is still a problem if ROI is used as the performancemeasure, in that the short-term low rate of return may not encourageinvestment in what is, in fact, a worthwhile project. A way round thisis to use annuity depreciation at a different rate that will ensure alevel ROI over the project life. The rate to be used will be the IRR ofthe project.
(d)ROI and RI using annuity depreciation at the project IRR
12% is now used instead of 8% in computing both the EAC of theinvestment and the interest on capital, yielding the following results:

Conclusion:
The ROI and the RI is now level over the project life, ensuring aconsistent decision whether the short-term or long-term view is taken.Using 12% as an appraisal rate for the project yields consistent resultsunder all three methods (NPV, ROI and RI) i.e. the project is atbreak-even.
This somewhat contrived approach is probably less useful than the one above when RI is used to assess performance.
In addition, the use of annuity depreciation does not produce helpful results when cash flows are uneven.

7 Economic Value Added (EVA)
7.1 What is EVA?
EVATM is a measure of performance similar to residualincome, except the profit figure used is ECONOMIC profit and the capitalemployed figure used is ECONOMIC capital employed. It is argued thatthe profit and capital employed figures quoted in the financialstatements do not give the true picture and that the accounting figuresneed to be adjusted to show the true underlying performance.
The basic concept of EVA is that performance should be measured interms of the value added during the period. It is a measure ofperformance that is directly linked to shareholder wealth.
EVA summary

Decision rule: accept the project if the EVA is positive.
What is NOPAT?
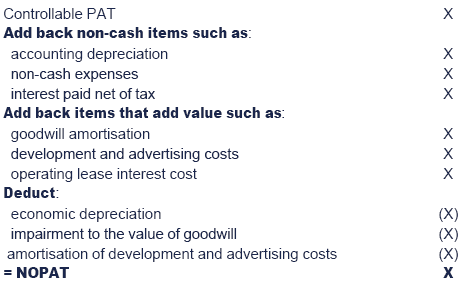

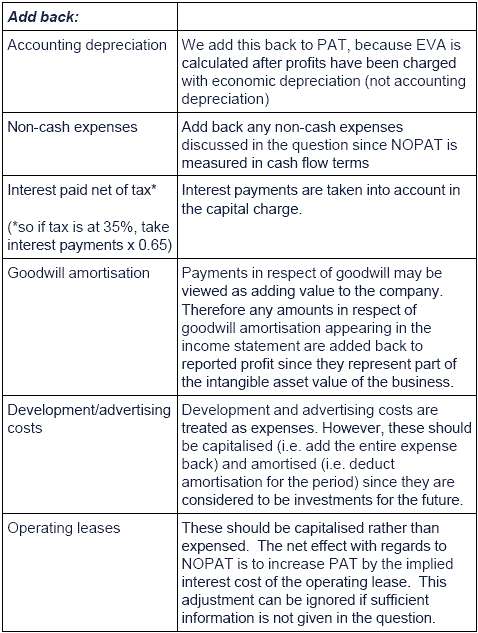
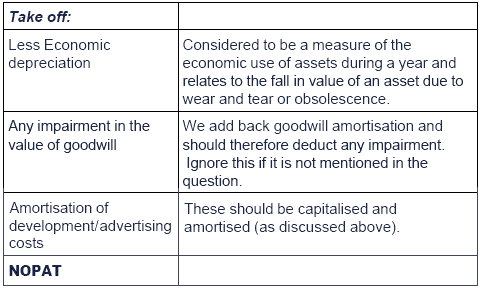
 Adjustments to PAT

What is the economic value of capital employed?
The main adjustments to the capital employed figure are as follows:
- an adjustment should be made to reflect the replacement cost of non-current assets rather than the book value.
- the net book value of any capitalised operating leases should be added back.
- the net book value of any capitalised development/advertising costs should be added back.
- the value of amortised goodwill should be added.
What is the WACC?
WACC = (proportion of equity × cost of equity) + (proportion of debt × post tax cost of debt)
For example suppose that a company is 60% financed by equity whichhas a cost of 10% pa and 40% financed by debt which has an after taxcost of 6%
WACC = (0.60 x 0.10) + (0.40 x 0.06) = 0.084 therefore 8.4%
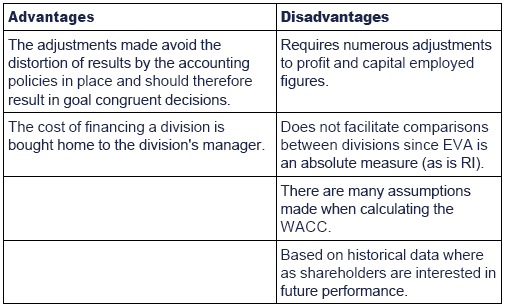
7.2 Advantages and disadvantages of EVA

 Test your understanding 5
A division has reported a PBIT of $42million. This is aftercharging $8million for the development and launch costs of a new productthat is expected to have a life of four years.
The division's non-current asset value is $100million and the netcurrent assets have a value of $44million. The replacement cost of thenon-current assets is estimated to be $128million.
The company's WACC is 12% and the taxation rate is 25%.
Required:
Calculate the division's EVA.


 Additional EVA example
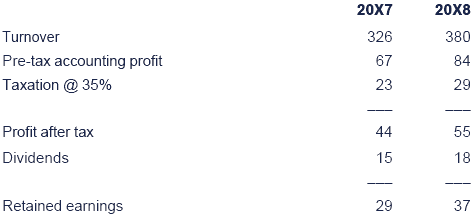
The managers of Trout Inc were surprised by a recent newspaperarticle, which suggested that the company's performance in the last twoyears have been poor.
The CEO commented that turnover had increased by nearly 17% andpre-tax profit by 25% between the last two financial years, and that thecompany compared well with others in the same industry.
Income statements ($million)
Statement of financial position ($million)

Other information:
(1) Trout Inc had non-capitalised leases valued at $10 million in each year.
(2) Balance sheet capital employed at the end of 20X6 was $223 million.
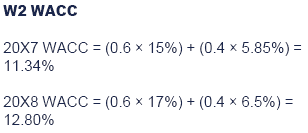
(3) The company's post tax cost of debt was 5.85% in 20X7 and 6.5% in 20X8.
(4) The company's cost of equity was 15% in 20X7 and 17% in 20X8.
(5) The target capital structure is 60% equity and 40% debt.
(6) Non-cash expenses were $10 million for both years
(7) Interest expense was $4 million in 20X7 and $6 million in 20X8.
Required:
(a) Estimate the Economic Value Added (EVA) for Trout Inc for both 20X7 and 20X8.
(b) Explain the relationship between EVA and NPV.
Solution
(a)EVA capital employed is based upon the bookeconomic value of capital at the beginning of the relevant period. Asthere is no information on full adjustments, the book value ofshareholders' funds and medium term debt, plus the value of capitalisedleases will be used.

(b) If the Economic Value Added (EVA's) foreach year of an investment are summed over the entire life of theinvestment and then discounted, the result, in theory, should equal thenet present value of the investment.

Question focus: Now attempt question 14 from chapter 13.
 8 Value-based management
This is a slight aside but it is worth covering here since it follows on from our discussion of EVA.
 Value-based management(VBM) is an approach to management whereby the company's strategy,objectives and processes are aligned to help the company focus on thekey drivers of shareholder wealth and hence the maximisation of thisvalue.
Measuring shareholder value
Traditionally, financial measures such as EPS and ROCE were used toquantify shareholder value. However, none of these measures directlycorrelates with the market value of the company (i.e. shareholdervalue).
Value-based performance management is an approach which takes theinterests of the shareholders as its primary focus. Measures include:
- EVA - this is the primary measure used. A positive EVA indicates value creation while a negative one indicates destruction.
- Market value added (MVA) - this is the accumulated EVAs generated by an organisation since it was formed.
- Shareholder value analysis - this is the application of a discounted cash flow technique to valuing the whole business rather than a single potential investment.

 Other value-based measures
As well as EVA consultants have produced a number of other value based measures, with each claiming its own merits.
1. Market value added (MVA)
MVA is the value added to the business by management since it wasformed, over and above the money invested in the company by shareholdersand long term debt holders. A positive MVA means value has been addedand a negative MVA means value has been destroyed.
MVA can effectively be seen as the accumulated EVAs generated by anorganisation over time. As such it should be highly correlated with EVAvalues. If year after year a company has a positive EVA then these willadd up to give a high MVA.
2. Shareholder value analysis.
SVA is an application of discounted cash flow techniques to valuing the whole business rather than a potential investment.
One problem in the estimation of future values is thattheoretically the cash flows go to infinity. A practical way to resolvethis is take free cash flows for a few years into the future (the'competitive advantage period') and then estimate the residual value ofthe organisation using either some market multiple or book value. Thevaluation of the company and hence the individual shares can be directlyderived from the SVA.
One criticism of the above is that the estimation of the terminalvalue is subjective. There is a problem in determining how many years'cash flows can be realistically projected into the future and thereforeat which point the terminal value should be calculated. However, allvaluation methods depend upon estimating either future dividends,earnings or cash flows and hence they all contain some element ofsubjectivity.

Companies using value-based management have implemented planning and control systems across the organisation to support it.
The techniques available for increasing and monitoring value will/have been covered in other chapters and include:
- The balanced scorecard
- Business process re-engineering
- TQM
- JIT
- ABC and ABM
- Benchmarking
9 The use of strategic models in divisional performance appraisal
- The matrices of Ansoff and the Boston Consulting Group (BCG) were met in paper P3 where they were used for strategic portfolio analysis.
- These frameworks can also be used for assessing performance management issues in divisionalised businesses.
9.1 Ansoff's matrix
- Ansoff's matrix is used to analyse the possible strategic directions that a division can follow.
- This in turn will highlight key areas, i.e CSFs, that need to be monitored and controlled.
- These strategies may result in the development of new divisions, closure of existing divisions or changes within existing divisions.

 Ansoff's strategies
Protect/build
Both short-term and long-term performance appraisal of products isrequired to determine which to divest and which to consolidate. Thenature and strength of the firm's competitive advantage is likely to becentral.
Market penetration is much easier if the market is growing aslarger competitors may not invest sufficiently to meet extra demand.However, the extra investment required may depress reported performance,at least initially.
Market development
Market development involves moving into new markets. Key areas of concern include:
- the attractiveness of the new market
- the risk of not fully understanding customer needs in the new market
- the effectiveness of barriers to entry
- the likely reaction of existing firms
- it may take time to achieve the required critical mass and the associated economies of scale. This is likely to depress performance in earlier years.
- a lack of an established reputation
- a lack of a supply chain infrastructure (e.g. distribution outlets).
Product development
Product development involves new products. Key areas of concern are thus:
- Will customers want the new product? Has enough market research been carried out first?
- Development costs and learning effects may give poor ROI initially.
- Will new products be based on extending existing capabilities or will new capabilities have to be created / acquired first? The strength of such capabilities will have to be monitored carefully.
- Potential quality control problems.
- Production capacity.
Diversification
One would expect diversification to be the riskiest strategy on thematrix, involving the risks of both product development and marketdevelopment.

9.2 The BCG Matrix
The BCG matrix shows whether the firm had a balanced portfolio in terms of products and market sectors.
Steps include:
(1) Divide the business into divisions.
(2) Allocate to the matrix.
(3) Assess the prospects of each division.
(4) Develop strategies and targets for each division.
If the relevant information is available, market growth and relative market share should be calculated as follows:
- Market growth = the % increase/decrease in annual market revenue
Note: if market revenue is given for a number of successiveyears the average % increase/decrease in annual market revenue can becalculated as follows:
1 + g = n √most recent market revenue ÷ ealiest market revenue
where g = the increase/decrease in annual market revenue as a decimal
n = the number of periods of growth
- Relative market share = divisions market share ÷ market leader's share
divisional market share = divisional revenue ÷ market revenue

 The BCG matrix


 Test your understanding 6
Food For Thought (FFT) Ltd has been established for over 20 years and has a wide range of food products.
The organisation has four divisions:
(1) Premier
(2) Organic
(3) Baby
(4) Convenience
The premier division manufactures a range of very high quality foodproducts, which are sold to a leading supermarket, with stores in everymajor city in the country. Due to the specialist nature of theingredients these products have a very short life cycle.
The Organic division manufactures a narrow range of food products for a well-established Organic brand label.
The baby division manufactures specialist foods for infants, which are sold to the largest UK Baby retail store.
The convenience division manufactures low fat ready-made meals for the local council.
The following revenue data has been gathered:
Year ending 31st March:
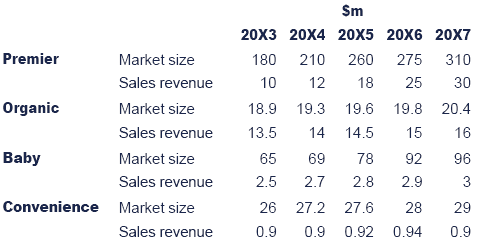
The management accountant has also collected the following information for 20X7 for comparison purposes.
Required:
Using the BCG matrix assess the competitive position of Food For Thought Ltd.


 Where products stand within the BCG matrix
The logical thrust here is that, if you enjoy a high market share,then you will probably have a strong position because of low unitproduction cost and a high market profile. A product that has a highgrowth potential offers obvious advantages but it is typicallyassociated with high development costs because of the need to developthe product itself and/or maintain the high market share.
The nature of the four classifications shown above isself-explanatory. An understanding of where given products stand inrelation to this matrix can be another essential element in strategicplanning. For example, if a product is a cash cow, then it may be veryuseful, but it should be appreciated that it may be at an advanced stagein its life cycle and the cash it generates should be invested inpotential stars.
However, it is not always easy to distinguish between a star and adog. Many businesses have poured money into the development of productsthat they believed were potential stars only to find that those productsturned into dogs. The Sinclair C5 (a small, battery-powered car) isoften quoted as an example of this phenomenon. The promoters of thisproduct in the 1980s proceeded on the basis that there was a market forsuch a car as a means of urban transport and that the C5 would enjoy ahigh share of this market. In fact, the only niche it found was as achildren's toy and it achieved only a low market share with littlegrowth potential as such.
The general point this model makes is that current period cash flowis not an unambiguous statement on the performance of a product orbusiness sector. To appreciate fully the performance of a product, onehas to appreciate where the product stands in terms of the above matrix.A poor current cash flow may be acceptable from a product or serviceconsidered to be a 'Star'.

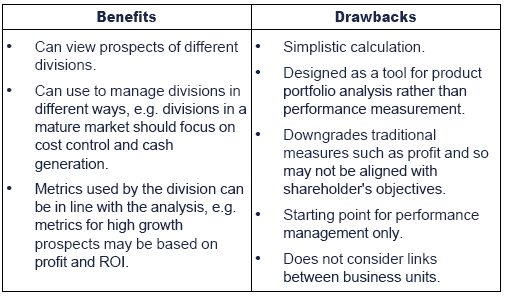
Use of BCG analysis as a performance management tool
10 Transfer pricing
10.1 Introduction
 The transfer price is the price at which good or services are transferred from one division to another within the same organisation.
Characteristics of a good transfer price
- Goal congruence - the transfer price that is negotiated and agreed upon by the buying and selling divisions should be in the best interests of the company overall.
- Fairness - the divisions must perceive the transfer price to be fair since the transfer price set will impact divisional profit and hence performance evaluation.
- Autonomy - the system used to set the transfer price should seek to maintain the autonomy of the divisional managers. This autonomy will improve managerial motivation.
- Bookeeping - the transfer price chosen should make it straightforward to record the movement of goods or services between divisions.
- Minimise global tax liability - multinational companies can use their transfer pricing policies to move profits around the world and thereby minimise their global tax liability.
10.2 The general rules for setting transfer prices
Scenario 1: There is a perfectly competitive market for the product/service transferred
Transfer price = market price
A perfect market means that there is only one price in the market,there are no buying and selling costs and the market is able to absorbthe entire output of the primary division and meet all the requirementsof the secondary division.
Scenario 2: the selling division has surplus capacity
Scenario 3: The selling division does not have any surplus capacity
10.3 Practical methods of transfer pricing
Method 1: Market based approach
- If a perfectly competitive market exists for the product, then the market price is the best transfer price.
- Care must be taken to ensure the division's product is the same as that offered by the market (e.g. quality, delivery terms, etc.).
- The market price should be adjusted for costs not incurred on an internal transfer, e.g. delivery costs.
Method 2: Cost based approach
- Alternatively, if a perfectly competitive market does not exist for the product, the transfer price can be set at cost + % profit.
- Standard cost should be used rather than actual cost to avoid inefficiencies being transferred from one department to another and to aid planning and budgeting.
- The cost may be:
- the marginal cost - this will be preferred by the buying division, i.e. they will consider the price to be fair.
- the full cost - this will be preferred by the selling division, i.e. they will consider the price to be fair.
- the opportunity cost - if there is no spare capacity in the selling division the opportunity cost should be added to the marginal cost/full cost.
- 'Fairness' is one of the key characteristics of a good transfer price. Two alternative approaches that may be perceived as fair by both the buying and the selling divisions are:
- marginal cost plus a lump sum (two part tariff) - the selling division transfers each unit at marginal cost and a periodic lump sum charge is made to cover fixed costs.
- dual pricing - the selling division records one transfer price (e.g. full cost + % profit) and the buying division records another transfer price (e.g. marginal cost). This will be perceived as fair but will result in the need for period-end adjustments in the accounts.

 Illustration 3 – Practical methods of transfer pricing
Manuco Ltd
Manuco Ltd has been offered supplies of special ingredient Z at atransfer price of $15 per kg by Helpco Ltd, which is part of the samegroup of companies. Helpco Ltd processes and sells special ingredient Zto customers external to the group at $15 per kg. Helpco Ltd bases itstransfer price on total cost-plus 25% profit mark-up. Total cost hasbeen estimated as 75% variable and 25% fixed.
Required:
Discuss the transfer prices at which Helpco Ltd should offer totransfer special ingredient Z to Manuco Ltd in order that group profitmaximising decisions may be taken on financial grounds in each of thefollowing situations.
(a)Helpco Ltd has an external market for allits production of special ingredient Z at a selling price of $15 per kg.Internal transfers to Manuco Ltd would enable $1.50 per kg of variablepacking cost to be avoided.
(b)Conditions are as per (i) but Helpco Ltd hasproduction capacity for 3,000kg of special ingredient Z for which noexternal market is available.
(c)Conditions are as per (ii) but Helpco Ltdhas an alternative use for some of its spare production capacity. Thisalternative use is equivalent to 2,000kg of special ingredient Z andwould earn a contribution of $6,000.
Solution
(a)Since Helpco Ltd has an external market,which is the opportunity foregone, the relevant transfer price would bethe external selling price of $15 per kg. This will be adjusted to allowfor the $1.50 per kg avoided on internal transfers due to packing costsnot required, i.e. the transfer price is $13.50 per kg.
(b)In this situation Helpco has no alternativeopportunity for 3,000kg of its special ingredient Z. It should,therefore, offer to transfer this quantity at marginal cost. This isvariable cost less packing costs avoided = $9 – $1.50 = $7.50 per kg(note: total cost = $15 x 80% = $12; variable cost = $12 x 75% =$9). The remaining amount of special ingredient Z should be offered toManuco Ltd at the adjusted selling price of $13.50 per kg (as above).
(c)Helpco Ltd has an alternative use for someof its production capacity, which will yield a contribution equivalentto $3 per kg of special ingredient Z ($6,000/2,000kg). The balance ofits spare capacity (1,000kg) has no opportunity cost and should still beoffered at marginal cost. Helpco Ltd should offer to transfer: 2,000kgat $7.50 + $3 = $10.50 per kg; 1,000kg at $7.50per kg (= marginal cost);and the balance of requirements at $13.50 per kg.


 Test your understanding 7
X plc, a manufacturing company, has two divisions: Division A andDivision B. Division A produces one type of product, ProdX, which ittransfers to Division B and also sells externally. Division B has beenapproached by another company which has offered to supply 2,500 units ofProdX for $35 each.
The following details for Division A are available:
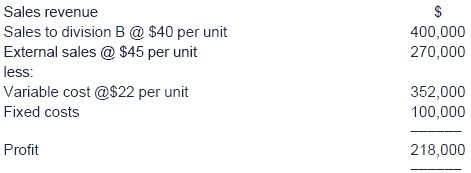
External sales of Prod X cannot be increased, and division B decides to buy from the other company.
Required:
(a)Calculate the effect on the profit of division A.
(b)Calculate the effect on the profit of company X.


 Test your understanding 8
A company operates two divisions, Able and Baker. Able manufacturestwo products, X and Y. Product X is sold to external customers for $42per unit. The only outlet for product Y is Baker.
Baker supplies an external market and can obtain its semi-finishedsupplies (product Y) from either Able or an external source. Bakercurrently has the opportunity to purchase product Y from an externalsupplier for $38 per unit. The capacity of division Able is measured inunits of output, irrespective of whether product X, Y or a combinationof both are being manufactured.
The associated product costs are as follows:

Required:
(a)Using the above information, provideadvice on the determination of an appropriate transfer price for thesale of product Y from division Able to division Baker under thefollowing conditions:
(i)when division Able has spare capacity and limited external demand for product X
(ii) when division Able is operating at full capacity with unsatisfied external demand for product X
(b)The design of an information system tosupport transfer pricing decision making necessitates the inclusion ofspecific data. Identify the data that needs to be collected and how youwould expect it to be used.

Question focus: now attempt question 15 from chapter 13.
10.4 International transfer pricing
Almost two thirds of world trade takes place within multi-nationalcompanies. Transfer pricing in multi-national companies has thefollowing complications:
Taxation
The selling and buying divisions will be based in differentcountries. Different taxation rates in these countries allows themanipulation of profit through the use of transfer pricing.

 Illustration 4 - Taxation and transfer pricing
Rosca Coffee is a multionational company. Division A is based inNorthland, a country with a tax rate of 50%. This division transfersgoods to division B at a cost of $50,000 per annum. Division B is basedin Southland, a country with a tax rate of 20%. Based on the currenttransfer price of $50,000 the profit of the divisions and of the companyis as follows:

Rosca Coffee want to take advantage of the different tax rates inNorthland and Southland and have decided to reduce the transfer pricefrom $50,000 to $20,000. This will result if the following revisedprofit figures:
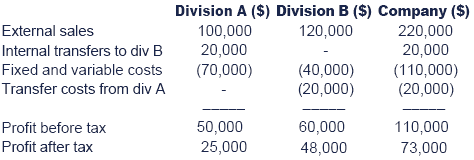
Conclusion: the manipulation of the transfer price has increased the company's profits from $64,000 to $73,000.

- Artificial attempts at reducing tax liabilities could, however, upset a country's tax authorities. Many tax authorities have the power to alter the transfer price and can treat the transactions as having taken place at a fair arms length price and revise profits accordingly.
Remittance controls
- A country's government may impose restrictions on the transfer of profits from domestic subsidiaries to foreign multinationals.
- This is known as a 'block on the remittances of dividends' i.e. it limits the payment of dividends to the parent company's shareholders.
- It is often done through the imposition of strict exchange controls.

 Test your understanding 9
Discuss how a multinational company could avoid the problem of blocked remittances.


 Additional example on international issues
A multinational organisation, C plc, has 2 divisions each in adifferent country – Divisions A and B. Suppose Division A produces aproduct X where the domestic income tax rate is 40% and transfers it toDivision B, which operates in a country with a 50% rate of income tax.An import duty equal to 25% of the price of product X is also assessed.The full cost per unit is $190, the variable cost $60.
Required:
The tax authorities allow either variable or full cost transfer prices. Determine which should be chosen.
Solution

Question focus: Now attempt question 16 from chapter 13.

Test your understanding answers

 Test your understanding 1

- Jon's decision - from a personal point of view, the ROI of Jon's division will go down and his bonus will be reduced or lost as a result. Therefore, Jon will reject the investment.
- However, the new equipment has a ROI of 20%. This is higher than the company's cost of capital (required return) of 15% and therefore Jon should accept the new investment.


 Test your understanding 2
ROI = (Earnings before interest and tax (but after depreciation))/(Capital employed (book value at start of year)) × 100

The ROI increases, despite no increase in annual profits, merely asa result of the book value of assets falling. Therefore, the divisionalmanager will be rewarded for holding onto old, and potentiallyinefficient, assets.


 Test your understanding 3
(a)

The division would not accept the investment since it would reduce the division's ROI.
However, this is not in the best interests of the company since theROI (20%) is greater than the company's cost of capital (10%).
(b)

The division would accept the investment since it generates an increase in RI of $1,000.
This decision is in the best interests of the company.
Note: Here is a classic example of ROI giving the wrongconclusion, in that a project that was worthwhile as far as the companywas concerned is rejected since it reduces the division's current ROI.


 Test your understanding 4
BEST OUTCOME
WORST OUTCOME
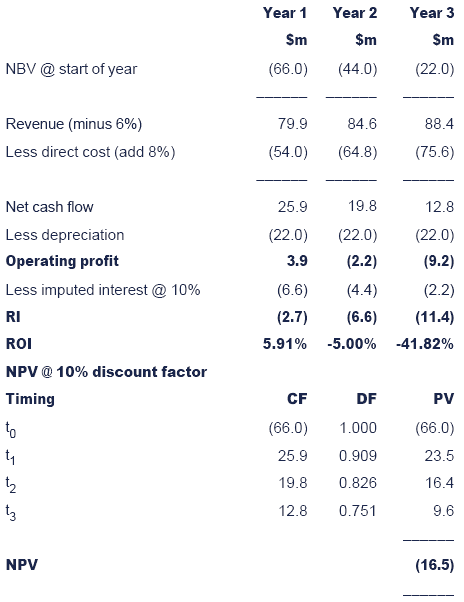
Note: Best outcome means inflated revenue and reduced costs, whilst worst outcome means deflated revenue and inflated costs


 Test your understanding 5


 Test your understanding 6

The management could use the BCG matrix in order to classify itssubsidiaries in terms of their rate of market growth and relative marketshare.
The model has four categories these are:
Stars
A star product has a relatively high market share in a growth market.
The Premier division is experiencing strong growth in a growing market.
It has a 10% market share and therefore it seems reasonable to categorise the Premier division as a star.
Problem child
They have a relatively low market share in a high growth market.The Baby division would appear to fall into this category. The marketleader enjoys a 25% share whilst the Baby division appear to bestruggling to achieve growth in turnover and hence profits.
Cash cow
A cash cow is characterised by a relatively high market share in a low growth market and should generate significant cash flows.
The Organic division appears to be a cash cow since it has a veryhigh market share in what can be regarded as a low growth market.
Dog
A dog is characterised by a relatively low market share in a lowgrowth market and might well be loss making. The Convenience divisionwould appear to fall into this category since its market share is verylow and it has low growth.
Food for thought has a dog and a problem child that both require immediate attention.
Competitors within the sector will resist any attempts to reducetheir share of a low growth or declining market. As far as the problemchild is concerned, the management need to devise appropriate strategiesto convert them into stars.


 Test your understanding 7
(a)Division A will lose the contribution frominternal transfers to Division B. Contribution foregone = 2,500 ×$(40-22) = $45,000 reduction.
(b)


 Test your understanding 8
(a)
(i)The transferprice should be set between $35 (minimum price Able will sell for) and$38 (maximum price Baker will pay). Able has spare capacity, thereforethe marginal costs to the group of Able making a unit is $35. If theprice is set above $38, Baker will be encouraged to buy outside thegroup, decreasing group profit by $3 per unit.
(ii) If Able supplies Baker with aunit of Y, it will cost $35 and they (both Able and the group) will lose$10 contribution from X. Therefore, the minimum price able will sellfor is $45. So long as the bought-in external price of Y to Baker isless than $45, Baker should buy from that external source.
(b)The following are required.
- Marginal costs (i.e. unit variable costs) and incremental fixed costs for various capacity levels for both divisions.
- External market prices if appropriate.
- External bought-in prices from suppliers outside the group.
- Opportunity costs from switching products.
- Data on capacity levels and resource requirements.


 Test your understanding 9
Blocked remittances might be avoided by means of:
- increasing transfer prices paid by the foreign subsidiary to the parent company (see below)
- lending the equivalent of the dividend to the parent company
- making payments to the parent company in the form of:
- royalties
- payments for patents
- management fees and charges
- charging the subsidiary company additional head office overheads.
Note: The government of the foreign country might try to prevent many of these measures being used.

|
Created at 5/24/2012 4:29 PM by System Account
(GMT) Greenwich Mean Time : Dublin, Edinburgh, Lisbon, London
|
Last modified at 5/25/2012 12:55 PM by System Account
(GMT) Greenwich Mean Time : Dublin, Edinburgh, Lisbon, London
|
|
|
|
 |
Rating
:
|
 Ratings & Comments
(Click the stars to rate the page) Ratings & Comments
(Click the stars to rate the page)
|
 |
Tags:
|
|
|
|
|