Cost behaviours
Within the one wider discussion of costing, one aspect is the need to understand cost behaviour. This is particularly important for budgeting.
Variable costs
Variable costs are costs that tend to vary in total with the level of activity. As activity levels increase then total variable costs will also increase.
Variable costs can be shown graphically as follows:
As total costs increase with activity levels, the cost per unit of variable costs remains constant.
Examples of variable costs include direct costs such as raw materials and direct labour.
Numerical example of variable costs
A factory is producing widgets. It takes 4m2 to make one widget and it costs $2 per square metre. If the factory makes 50 widgets if costs $400, if the factory makes 100 widgets it costs $800. The cost incurred increases inline with the volume being produced - graph 1 demonstrates this.
The material for each widget costs 4 x $2 = $8 and it does not change if more or less widgets are made. The variable cost per unit remains constant - graph 2 demonstrates this.
Fixed costs
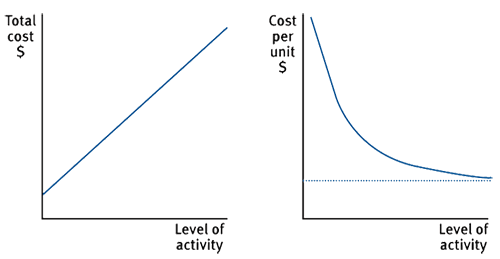
A fixed cost is a cost which is incurred for an accounting period, and which, within certain activity levels remains constant.
Fixed costs can be shown graphically as follows:
The total cost remains constant over a given level of activity but that the cost per unit falls as the level of activity increases.
Examples of fixed costs include rent, business rates and executive salaries.
Numerical illustration of a fixed cost graph
If factory rent is $5,000 per month, this cost will be incurred whether 2 widgets are made, or 200 widgets are made - graph 1 demonstrates this.
If 2 widgets are made the fixed cost per unit is $5,000/2 i.e. $2,500 per widget.
If 200 widgets are made the fixed cost per unit is $5,000/200, i.e. $25 per widget.
Therefore, the fixed cost per unit falls at a reducing rate but never reaches zero - graph 2 demonstrates this.
Stepped fixed costs
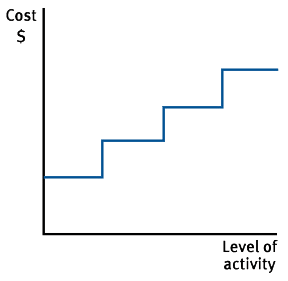
This is a type of fixed cost that is only fixed within certain levels of activity. Once the upper limit of an activity level is reached then anew higher level of fixed cost becomes relevant.
Stepped fixed costs can be shown graphically as follows:

Examples of stepped fixed costs:
- warehousing costs (as more space is required, more warehouses must be purchased or rented)
- supervisors' wages (as the number of employees increases, more supervisors are required).
Numerical example of stepped costs
For production of up to 50 widgets, only one supervisor is required but if production is between 50 and 100 widgets, two supervisors are required.
The cost of one supervisor is $18,000 per annum and the cost of two supervisors is therefore $36,000.
The fixed costs therefore increase in steps as shown in the stepped fixed cost graph above.
Semi-variable costs
Semi-variable costs contain both fixed and variable cost elements and are therefore partly affected by fluctuations in the level of activity.
Semi-variable costs can be shown graphically as follows:

Examples of semi-variable costs:
- electricity bills (fixed standing charge plus variable cost per unit of electricity consumed)
- telephone bills (fixed line rental plus variable cost per call)
Further detail and related topics
Sometimes it is necessary to separate out the variable cost element and the fixed cost element from a semi-variable cost for example to amend a budget. This is done using using the The High low method.
|
Created at 5/31/2012 11:34 AM by System Account
(GMT) Greenwich Mean Time : Dublin, Edinburgh, Lisbon, London
|
Last modified at 11/14/2012 11:09 AM by System Account
(GMT) Greenwich Mean Time : Dublin, Edinburgh, Lisbon, London
|
|
|
|
 |
Rating
:
|
 Ratings & Comments
(Click the stars to rate the page) Ratings & Comments
(Click the stars to rate the page)
|
 |
Tags:
|
|
|
|
|