Financial Performance Indicators (FPIs)
All organisations have financial performance measures as part of their performance management, although there is debate as to the relative importance of financial and non-financial indicators.
The objectives of profit-seeking organisations
Proponents of financial performance measures argue that they are necessary because of the primary objectives of companies.
Maximising shareholder wealth
- The primary objective of a profit seeking organisation is to maximise shareholder wealth.
- This is based on the argument that shareholders are the legal owners of a company and so their interests should be prioritised.
- Shareholders are generally concerned with the following:
- current earnings
- future earnings
- dividend policy
- relative risk of their investment.

All of these are driven by financial performance.
Survival and growth
The objective of wealth maximisation is usually expanded into three sub-objectives:
- to make a profit (see above)
- to continue in existence (survival) - survival is the ultimate measure of success of a business. Without survival then obviously there will be no fulfillment of other objectives. In order to survive in the long-term a business must be financially successful
- to maintain growth and development - growth is generally seen as a sign of success, provided it results in improvements in financial performance.
Growth can be identified in a number of ways both financial and non-financial.
Financial:
Non-financial:
- market share
- number of employees
- number of products.
The relationship between profits and shareholder value
Rather than focusing on achieving higher profit levels, companies are under increasing pressure to look at the long-term value of the business. This is due to the following factors.
- research has suggested a poor correlation between shareholder return and profits
- investors are increasingly looking at long-term value
- reported profits may not be comparable between companies.
While these issues have been known for some time, they have come into sharp focus due to the performance of new technology/communications companies.
Shareholder return and profits
Total shareholder return (TSR) is the return shareholders receive both in dividends and capital growth.
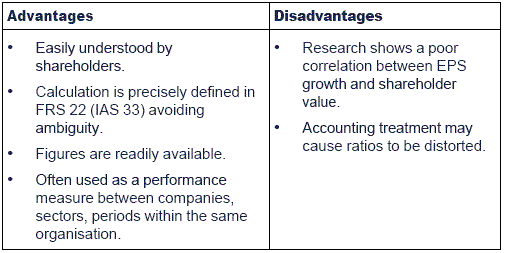
Studies have found that there is little correlation between TSR and EPS growth, and virtually no relationship at all with return on equity, yet many companies are still using profit as their only measure of performance.
Even where companies state that their objective is to maximise shareholder value, often directors' bonuses are still based on short-term profitability or EPS targets.
However strong evidence has been found between shareholder value and future cash flows, another financial measure.
Traditional financial performance measures
Financial performance exists at different levels of the organisation. This page is mostly concerned with measuring the financial performance of the organisation as a whole, and of measuring the performance of key projects. Furtehr measures are used as part of the particualr problem of divisional performance appraisal.
Traditionally, financial performance measures are split into the following categories:
- Profitability
- Liquidity / working capital
- Gearing
- Investor ratios
Profitability measures
Return on capital employed (ROCE)
ROCE is a key measure of profitability. It shows the net profit that is generated from every $1 of assets employed.
- ROCE is sometimes calculated using PBIT instead of net profit. Use whichever figure is given in the exam.
- Capital employed = total assets less current liabilities or total equity plus long-term debt.
- Capital employed may be based on net book value (NBV), gross book value or replacement cost. (note to students: Use whichever figure is given in the exam.

An increase in ROCE could be achieved by:
- Increasing net profit, e.g. through an increase in sales price or through better control of costs.
- Reducing capital employed, e.g. through the repayment of long term debt.
The ROCE can be understood further by calculating the net profit margin and the asset turnover:
ROCE = net profit margin × asset turnover
Gross profit margin
This is the gross profit as a percentage of turnover.
A high gross profit margin is desirable. It indicates that either sales prices are high or that production costs are being kept well under control.
Net profit margin
This is the net profit (turnover less all expenses) as a percentage of turnover.
A high net profit margin is desirable. It indicates that either sales prices are high or that all costs are being kept well under control.
Asset turnover
This is the turnover divided by the capital employed. The asset turnover shows the turnover that is generated from each $1 of assets employed.
A high asset turnover is desirable. An increase in the asset turnover could be achieved by:
- Increasing turnover, e.g. through the launch of new products or a successful advertising campaign.
- Reducing capital employed, e.g. through the repayment of long term debt.
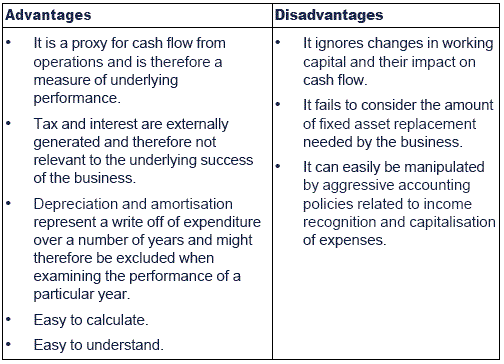
EBITDA
EBITDA is:
- earnings before interest, tax and depreciation adjustment or
- earnings before interest, tax, depreciation and amortisation.
The two versions are entirely interchangeable.

Liquidity measures
The main reason why companies fail is poor cash management rather than profitability so it is vital that liquidity is managed.
A company can be profitable but at the same time encounter cash flow problems. Liquidity and working capital ratios give some indication of the company's liquidity.
Current ratio
This is the current assets divided by the current liabilities.
The ratio measures the company's ability to meet its short term liabilities as they fall due.
A ratio in excess of 1 is desirable but the expected ratio varies between the type of industry.
A decrease in the ratio year on year or a figure that is below the industry average could indicate that the company has liquidity problems.The company should take steps to improve liquidity, e.g. by paying creditors as they fall due or by better management of receivables in order to reduce the level of bad debts.
Quick ratio (acid test)
This is a similar to the current ratio but inventory is removed from the current assets due to its poor liquidity in the short term.
The comments are the same as for the current ratio.
Inventory holding period
This indicates the average number of days that inventory items are held for.
An increase in the inventory holding period could indicate that the company is having problems selling its products and could also indicate that there is an increased level of obsolete stock. The company should take steps to increase stock turnover, e.g. by removing any slow moving or unpopular items of stock and by getting rid of any obsolete stock.
A decrease in the inventory holding period could be desirable as the company's ability to turn over inventory has improved and the company does not have excess cash tied up in inventory. However, any reductions should be reviewed further as the company may be struggling to manage its liquidity and may not have the cash available to hold the optimum level of inventory.
Receivables (debtor) collection period
This is the average period it takes for a company's credit customers / debtors / receivables to pay what they owe.
An increase in the receivables collection period could indicate that the company is struggling to manage its debts. Possible steps to reduce the ratio include:
- Credit checks on customers to ensure that they will pay on time
- Improved credit control, e.g. invoicing on time, chasing up bad debts.
A decrease in the receivables collection period may indicate that the company's has improved its management of receivables. However, a receivables collection period well below the industry average may make the company uncompetitive and profitability could be impacted as a result.
Payables (creditor) period

This is the average period it takes for a company to pay for its purchases.
An increase in the company's payables period could indicate that the company is struggling to pay its debts as they fall due. However, it could simply indicate that the company is taking better advantage of any credit period offered to them.
A decrease in the company's payables period could indicate that the company's ability to pay for its purchases on time is improving.However, the company should not pay for its purchases too early since supplier credit is a useful source of finance.
Gearing ratios
In addition to managing profitability and liquidity it is also important for a company to manage its financial risk. The following ratios may be calculated:
Financial gearing
This is the long term debt as a percentage of equity.
A high level of gearing indicates that the company relies heavily on debt to finance its long term needs. This increases the level of risk for the business since interest and capital repayments must be made on debt, where as there is no obligation to make payments to equity.
The ratio could be improved by reducing the level of long term debt and raising long term finance using equity.
Interest cover
This is the operating profit (profit before finance charges and tax) divided by the finance cost.
A decrease in the interest cover indicates that the company is facing an increased risk of not being able to meet its finance payments as they fall due.
The ratio could be improved by taking steps to increase the operating profit, e.g. through better management of costs, or by reducing finance costs through reducing the level of debt.
Other investor ratios
Investors will be interested in all of the above measures, along with the following:
Earnings Per Share (EPS)
EPS is a measure of the profit attributable to each ordinary share.
For EPS to be truly meaningful, it must be set in context.
- Is EPS growing or declining over time?
- Is there likely to be significant dilution of EPS?
- Is it calculated consistently?

Dividend cover
This is the net profit divided by the dividend.

A decrease in the dividend cover indicates that the company is facing an increased risk of not being able to make its dividend payments to shareholders
Dividend yield
- Dividend yield = (Dividend per share/Current share price) × 100%
This is one way of measuring the return to shareholders but ignores any capital growth / loss.
Earnings yield
Earnings yield = (EPS/Share price) × 100%This is another one way of measuring the return to shareholders but, as with dividend yield, ignores any capital growth / loss.
Shareholder value
As discussed above, profit based measures have a poor correlation with shareholder value. Measures that have a closer correlation include the following:
|
Created at 8/9/2012 11:38 AM by System Account
(GMT) Greenwich Mean Time : Dublin, Edinburgh, Lisbon, London
|
Last modified at 11/1/2016 3:07 PM by System Account
(GMT) Greenwich Mean Time : Dublin, Edinburgh, Lisbon, London
|
|
|
|
 |
Rating
:
|
 Ratings & Comments
(Click the stars to rate the page) Ratings & Comments
(Click the stars to rate the page)
|
 |
Tags:
|
|
|
|
|