CVP Analysis (Single product)
When considering output decisions (e.g. how many units to make and sell) in the short term, then decision making often focuses on contribution. Key decisions relate to the following:
- How many units do we need to sell to break even?
- What safety margin do we expect?
- How many units need to be sold to achieve a target profit?
Breakeven point (B.E.P.)
To calculate the number of units that must be made and sold in order to break even, we will use the following formula :

Here, contribution per unit is calculated as $25 - $20 = $5 per unit; Breakeven point will therefore be $50,000 / $5, or 10,000 units.
Units required to achieve target profit
To calculate the level of activity that is required to generate a profit of, say, $40,000, we will use the following formula.

Here, the number of units would be calculated as ($40,000 + $50,000 fixed costs) / $5 = 18,000 units.
The margin of safety
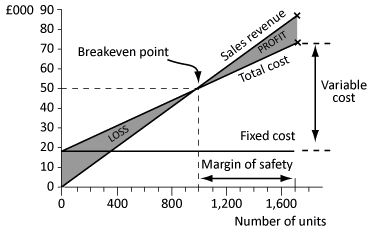
The margin of safety is the difference between the budgeted level of activity, and the break-even level of activity. It may be expressed in terms of units, sales value or as a percentage of the original budget.
Assume for example that the company budgets to sell 13,000 units of Product PQ. Its margin of safety would be calculated as follows :
Margin of safety = 13,000 - 10,000 = 3,000 units;
In terms of sales revenue, this is 3,000 x $25 = $75,000;
As a percentage of the budget, this is (3,000 units / 13,000 units) x 100 %, i.e. 23,1%.
Contribution to Sales ratio
The C/S ratio (also confusingly known as the PV ratio) is normally expressed as a percentage. It is constant at all levels of activity. The C/S ratio reveals the amount of contribution that is earned for every $1 worth of sales revenue. The following formula is therefore used :

For Product PQ, the C/S ratio can be calculated as $5/$25, or 20%.
Breakeven Revenue
The break-even point can be calculated again, but this time expressed in terms of sales revenue :

For the PQ company, this BEP will be calculated as $50,000 / 0.20 = $250,000.
Likewise, the sales revenue required to generate a profit of $40,000 can be calculated as follows.

Required sales = ($40,000 + £50,000) / 0.20 = $450,000.
Charts
Basic Breakeven Chart
A basic breakeven chart records costs and revenues on the vertical axis (y) and the level of activity on the horizontal axis (x). Lines are drawn on the chart to represent costs and sales revenue. The breakeven point can be read off where the sales revenue line cuts the total cost line.

The contribution breakeven chart
One of the problems with the conventional or basic breakeven chart is that it is not possible to read contribution directly from the chart. A contribution breakeven chart is based on the same principles, but it shows the variable cost line instead of the fixed cost line. The same lines for total cost and sales revenue are shown so the breakeven point, and profit can be read off in the same way as with a conventional chart. However, it is also possible also to read the contribution for any level of activity.
The Profit - Volume Chart
Another form of breakeven chart is the profit-volume chart. This chart plots a single line depicting the profit or loss at each level of activity. The breakeven point is where this line cuts the horizontal axis. A profit-volume graph for our example is shown below.
The vertical axis shows profits and losses and the horizontal axis is drawn at zero profit or loss.
The profit-volume graph is also called a profit graph or a contribution-volume graph.
The main advantage of the profit-volume chart is that it is capable of depicting clearly the effect on profit and breakeven point of any changes in the variables.
Further complications
The above analysis can be adapted to take into account multiple products rather than just one.
|
Created at 5/31/2012 2:40 PM by System Account
(GMT) Greenwich Mean Time : Dublin, Edinburgh, Lisbon, London
|
Last modified at 4/25/2013 2:48 PM by System Account
(GMT) Greenwich Mean Time : Dublin, Edinburgh, Lisbon, London
|
|
|
|
 |
Rating
:
|
 Ratings & Comments
(Click the stars to rate the page) Ratings & Comments
(Click the stars to rate the page)
|
 |
Tags:
|
|
|
|
|