Corporate Failure
A key part of performance management is being able to detect signs of corporate distress / failure and be able to take corrective action before it is too late. This page looks at the topic of corporate failure and how to detect it.
Why do companies fail?
Reasons include:
(1) Failing to adapt to changes in the environment
Reasons for failing to adapt include:
- complacency
- risk-averse decision making
- economies of production and administration
- limited opportunities for innovation and diversification
- limited mental models.
Complacency is a charge frequently levelled at managers, and there are, no doubt, occasions when senior managers convince themselves that everything is fine, when it is not. However, the charge is frequently made with the benefit of hindsight, rather than observation of the efforts made by those managers at the time. There are several entirely sensible reasons why managers are reluctant to make large strategic changes.
First, it is not possible to quantify the risks of making a major change. Several studies have shown that predicting changes in the environment and devising appropriate counter-measures is among the most difficult things a manager is required to do. Only in hindsight are the dynamics clear. It is worth remembering that case studies are written backwards, where a known outcome is traced back to its origins.
Faced with such difficulties, managers are reluctant to make large-scale changes that might risk increasing the problems, and might be very difficult to implement adequately. Rather, they select options of relatively limited impact - a process referred to as logical incrementalism.
Secondly, changes to production can reduce the opportunities for economies of scale, and raise the firm's cost base. There is always a temptation to try to retain share, by reducing price, rather than make fundamental changes to a product of its method of production and risk escalating costs.
Thirdly, it may be that management is entirely aware that the strategic situation is worsening, but be unable to see opportunities to innovate or diversify out of trouble. It must be accepted that there are situations where there are no feasible solutions, and there might be better uses of the shareholders' funds than attempts to turn the business round.
Finally, a large part of the problem is caused by the mental models of those who have control of the strategy within an organisation. A mental model is the way that individuals think about problems and issues. We look (below) at Johnson's notion of strategic drift, where the firm's mental models stop the company from changing quickly enough to keep up with environmental change.
(2) Strategic drift
Strategic drift is a term devised by Johnson (1988) to describe as a warning to those who champion the idea of strategy emerging as a series of logical, incremental steps. Johnson argues that this limits the rate of change to the speed at which management might feel comfortable, which has many advantages (particularly in implementation), but might be inappropriate in periods when the environment moves very quickly.
As outlined above, the organisation takes a series of logical,incremental steps that enables it to change ahead of the market,developing a competitive advantage. However, the rate of change in the market place speeds up, and the firm's incrementalist approach is not enough to maintain its advantage, and it is left behind. At this point,the firm must abandon the approach, and adopt radical, discontinuous change in order to stay with the market leaders.
Johnson's main argument is that the reasons for failing to increase the tempo of change are largely cultural, rather than technical. He argues that the corporate paradigm, as revealed by its cultural web and described in an earlier chapter, is the biggest constraint on strategic thinking and action. It is important to see that management cannot change a corporate paradigm, partly because they are themselves caught up in it, and partly because some elements of it are not amenable to management techniques. Logical incrementalism is successful because it does not challenge the underlying paradigm, allowing change to take place relatively smoothly. More revolutionary change must damage the paradigm before it can begin.
Assessing the likelihood of failure
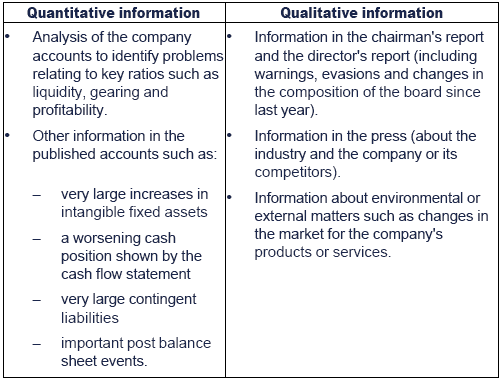
The following information can be used when assessing the likelihood of corporate failure:

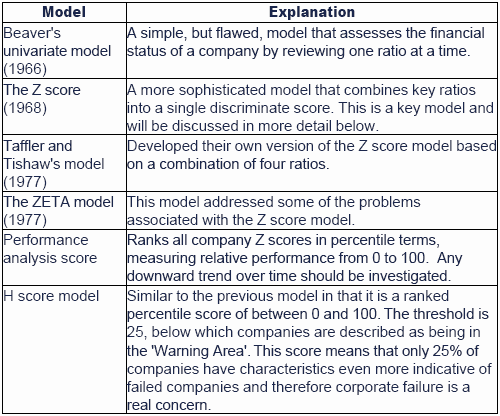
Corporate failure prediction models
Quantitative models

Calculating a Z score
The Z score is generated by calculating five ratios, which are then multiplied by a pre-determined weighting factor and added together to produce the Z score. The formula is:
Z score = 1.2X1+ 1.4X2 + 3.3X3 + 0.6X4 + 1.0X5
Where:
X1 = working capital/total assets
X2 = retained earnings/total assets
X3 = earnings before interest and tax/total assets
X4 = market value of equity/total liabilities
X5 = sales/total assets
The score indicates the likelihood of failure:
- Less that 1.81 - companies with a Z score of below 1.81 are in danger and possibly heading towards bankruptcy
- Between 1.81 and 2.99 - companies with scores between 1.81 and 2.99 need further investigation.
- 3 or above - companies with a score of 3 or above are financially sound.
Limitations of quantitative models
- The score estimated is a snapshot.
- Further analysis is needed to fully understand the situation, e.g. cash flow projections, detailed cost information, environmental review.
- Scores are only good predictors in the short-term.
- Figures are open to manipulation.
- The Z score model only gives guidance below the danger level of 1.81. Further investigation is needed for those organisations with scores between 1.81 and 2.99.
Qualitative models - Argenti's A score
The most notable qualitative model is Argenti's A score model.
Argenti suggested that the failure process follows a predictable sequence:
(1) Defects - include management weaknesses (such as an autocratic chief executive) and accounting deficiencies (such as n budgetary control). Each defect is given a score. A mark of 10 or more out of a possible 45 is considered unsatisfactory.
(2) Mistakes - will occur over time as a result of the defects above. Mistakes include high gearing, overtrading or failure of a big project. A score of more than 15 out of a possible 45 is considered unsatisfactory.
(3) Symptoms of failure - mistakes will eventually lead to visible symptoms of failure, e.g. deteriorating ratios or creative accounting.
If the overall score is more than 25 the company has many of the signs preceding failure and is therefore a cause for concern.
Limitations of qualitative models include:
- Based on the subjective judgement of experts (also a strength).
- Requires a large amount of financial and non-financial information (also a strength).
- Results are only as good as inputs into them.
Performance improvement strategies
The key to preventing corporate failure is to spot the warning signs early, and take corrective action quickly.
- The actions needed will depend on the particular situation. Once the signs of impending failure are seen, it is important to investigate and identify the causes.
- These may be related to a range of different functions within the business, such as financial management, marketing or production.
- It may sometimes be necessary to seek external advice to help to identify the problem.
- It is important that the managers of the business accept that there is a problem and that mistakes have been made and to move on to a solution, rather than apportioning blame.
- Actions may involve major strategic change, such as getting out of a loss-making business, or making changes to the way operations are managed, such as changes to production management.
- The action needed may include putting in controls to prevent further loss.
- The best strategy to prevent failure is to have effective management systems in place to begin with.
The performance management system will need to reflect the performance improvement strategies:
- a link should be established between the new strategic goals and CSFs
- performance targets should be set at all levels and these should relate to the achievement of strategic objectives
- continuous review of actual performance against targets will be required
- additional training and development needs must be met.
Long-term survival and the product life cycle
The 'classic' product life cycle
The 'classic' life cycle for a product has four phases, with different CSFs.
- An introduction phase, when the product or service is first developed and introduced to the market. Sales demand is low whilst potential customers learn about the item. There is a learning process for both customers and the producer, and the producer might have to vary the features of the product or service, in order to meet customer requirements more successfully.
- A growth phase, when the product or service becomes established and there is a large growth in sales demand. The number of competitors in the market also increases, but customers are willing to pay reasonably high prices. The product becomes profitable. Variety in the product or service increases, and customers are much more conscious of quality issues.
- A maturity phase, which might be the longest stage in the product life cycle. Demand stabilises, and producers compete on price.
- A decline phase, during which sales demand falls. Prices are reduced to sustain demand and to slow the decline in sales volume. Eventually the product becomes unprofitable, and producers stop making it.
Long-term survival necessitates consideration of life-cycle issues:
Issue 1: There will be different CSFs at different stages of the life cycle. In order to ensure that performance is managed effectively KPIs will need to vary over different stages of the lifecycle.
Issue 2: The stages of the life cycle have different intrinsic levels of risk:
- The introduction period is clearly a time of high business risk as it is quite possible that the product will fail.
- The risk is still quite high during the growth phase because the ultimate size of the industry is still unknown and the level of market share that can be gained and retained is also uncertain.
- During the maturity phase the risk decreases and the final phase should be regarded as low risk because the organisation knows that the product is in decline and its strategy should be tailored accordingly.
Understanding and responding to these risks is vital for the future success of the organisation.
If there is an analysis of the developing risk profile it should be compared with the financial risk profiles of various strategic options,making it much easier to select appropriate combinations and to highlight unacceptably high or low total risk combinations. This for an organisation to decide to finance itself with debt during the development stage would represent a high total risk combination.
|
Created at 6/13/2012 3:36 PM by System Account
(GMT) Greenwich Mean Time : Dublin, Edinburgh, Lisbon, London
|
Last modified at 11/14/2012 9:59 AM by System Account
(GMT) Greenwich Mean Time : Dublin, Edinburgh, Lisbon, London
|
|
|
|
 |
Rating
:
|
 Ratings & Comments
(Click the stars to rate the page) Ratings & Comments
(Click the stars to rate the page)
|
 |
Tags:
|
|
|
|
|